Fig. 2.
Download original image
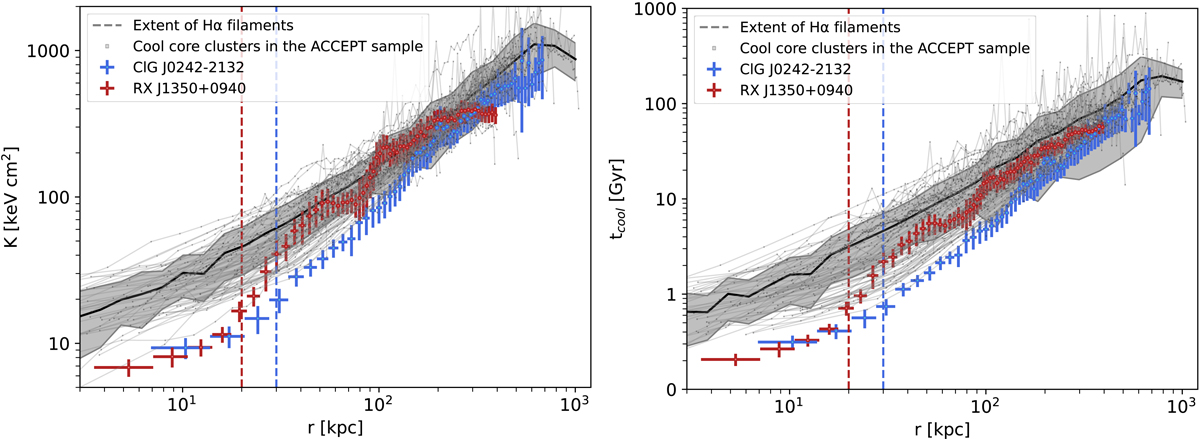
Profiles of ICM entropy (left) and cooling time (right) for the ACCEPT cool-core clusters with kT ≥ 2 keV are plotted in gray, while those of ClG J0242−2132 and RX J1350+0940 are plotted in blue and red, respectively. The black line and the shaded gray area represent the average profile and the scatter of the ACCEPT clusters, respectively. Readers can refer to Sect. 3.2 for details.
Current usage metrics show cumulative count of Article Views (full-text article views including HTML views, PDF and ePub downloads, according to the available data) and Abstracts Views on Vision4Press platform.
Data correspond to usage on the plateform after 2015. The current usage metrics is available 48-96 hours after online publication and is updated daily on week days.
Initial download of the metrics may take a while.