Fig. 1.
Download original image
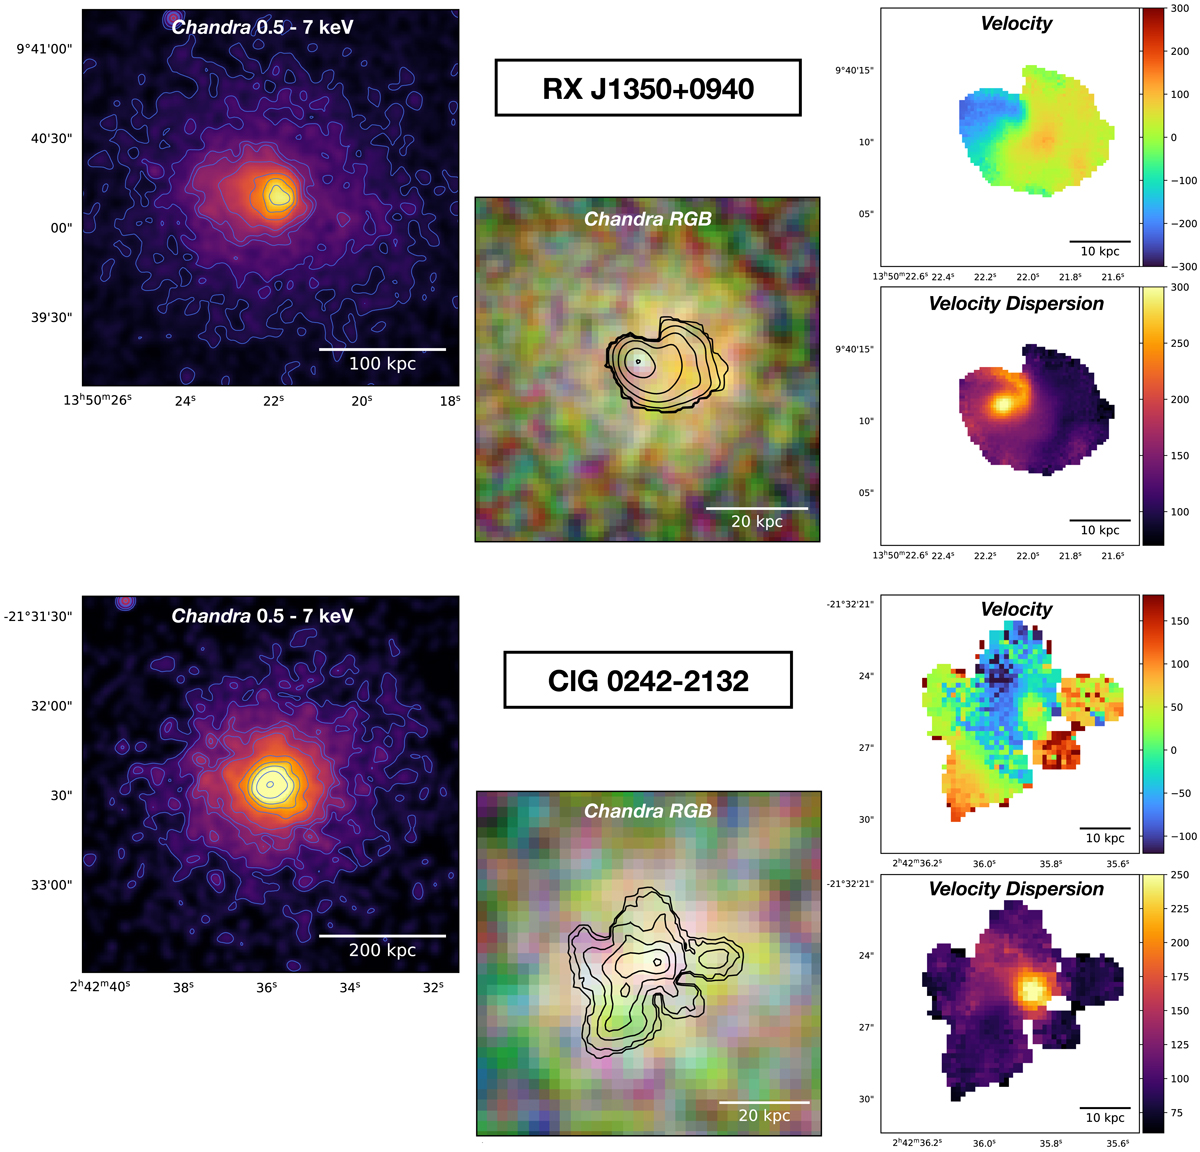
Chandra and MUSE images of the targets. For each object, we show in the left panel a (background-subtracted and exposure-corrected) Chandra image in the 0.5−7 keV band of the large-scale ICM emission. Contours start from the peak of the X-ray emission and decrease in steps by a factor of two. The images have been smoothed with a Gaussian of σ = 3 pixels. The middle panel shows a RGB Chandra image of the central region of each cluster, with the bands 0.3−1.2, 1.2−2.5, and 2.5−7.0 keV being shown as red (R), green (G), and blue (B), respectively. Overlaid in black are the total intensity Hα contours from the MUSE data. In the right panels, we show the warm gas kinematics (top) and velocity dispersion (bottom).
Current usage metrics show cumulative count of Article Views (full-text article views including HTML views, PDF and ePub downloads, according to the available data) and Abstracts Views on Vision4Press platform.
Data correspond to usage on the plateform after 2015. The current usage metrics is available 48-96 hours after online publication and is updated daily on week days.
Initial download of the metrics may take a while.