Open Access
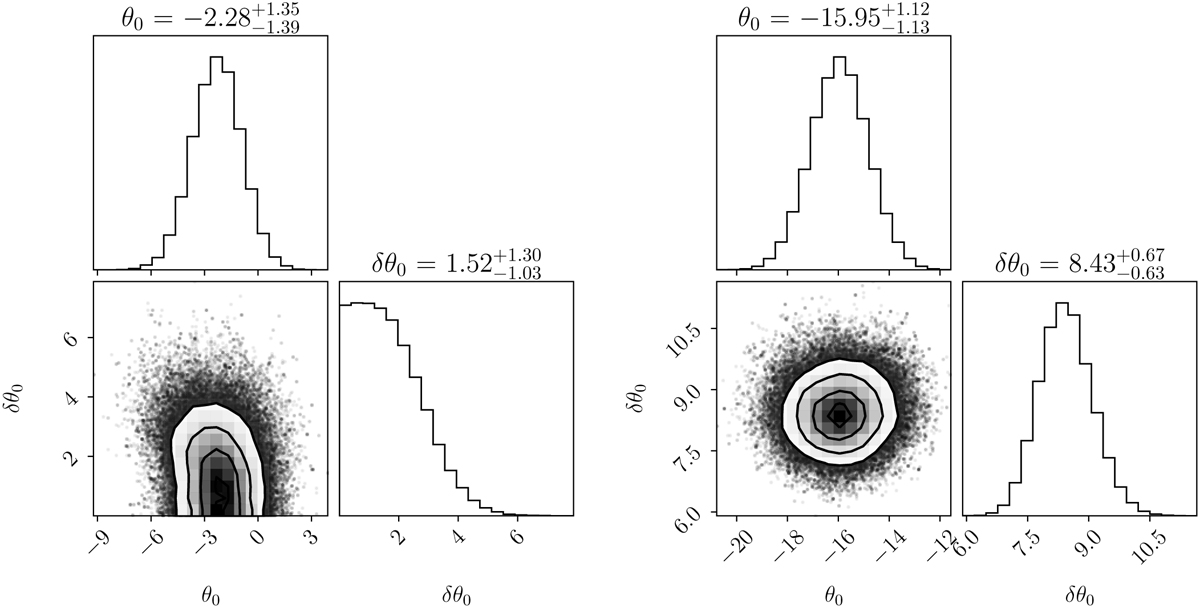
Fig. 8
Download original image
1D, and 2D marginalized posterior distributions of θ0, and δθ0 for regions I (left panel) and II (right panel). These plots were produced with the corner plot function of Foreman-Mackey (2016).
Current usage metrics show cumulative count of Article Views (full-text article views including HTML views, PDF and ePub downloads, according to the available data) and Abstracts Views on Vision4Press platform.
Data correspond to usage on the plateform after 2015. The current usage metrics is available 48-96 hours after online publication and is updated daily on week days.
Initial download of the metrics may take a while.