Open Access
Fig. 6
Download original image
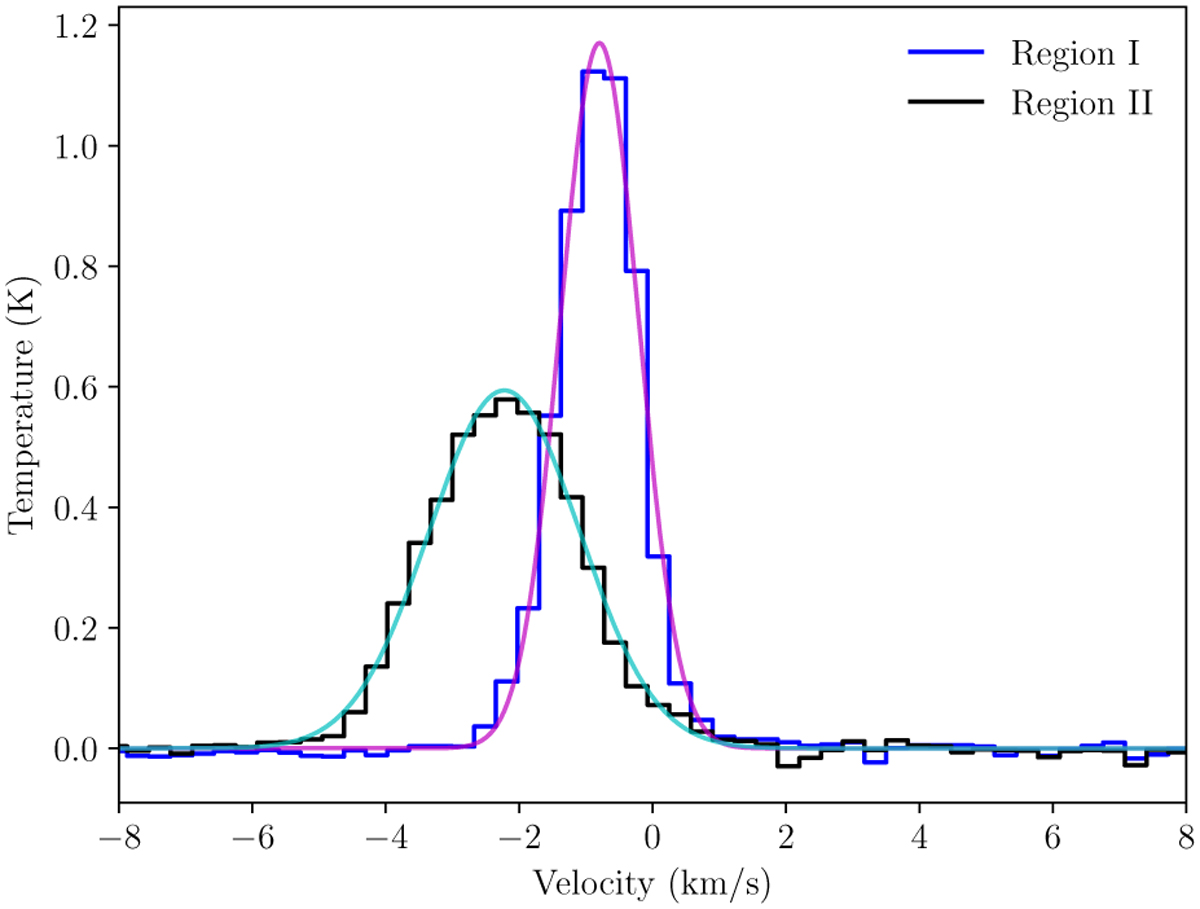
Averaged CO spectra toward regions I and II. The width of each bin is equal to the spectral resolution. Colored lines correspond to Gaussian fits. The mean velocities of regions I and II are −0.80, and −2.22 km s−1, respectively. The FWHM line widths in regions I and II are 1.39 and 2.61 km s−1, respectively.
Current usage metrics show cumulative count of Article Views (full-text article views including HTML views, PDF and ePub downloads, according to the available data) and Abstracts Views on Vision4Press platform.
Data correspond to usage on the plateform after 2015. The current usage metrics is available 48-96 hours after online publication and is updated daily on week days.
Initial download of the metrics may take a while.