Fig. 5
Download original image
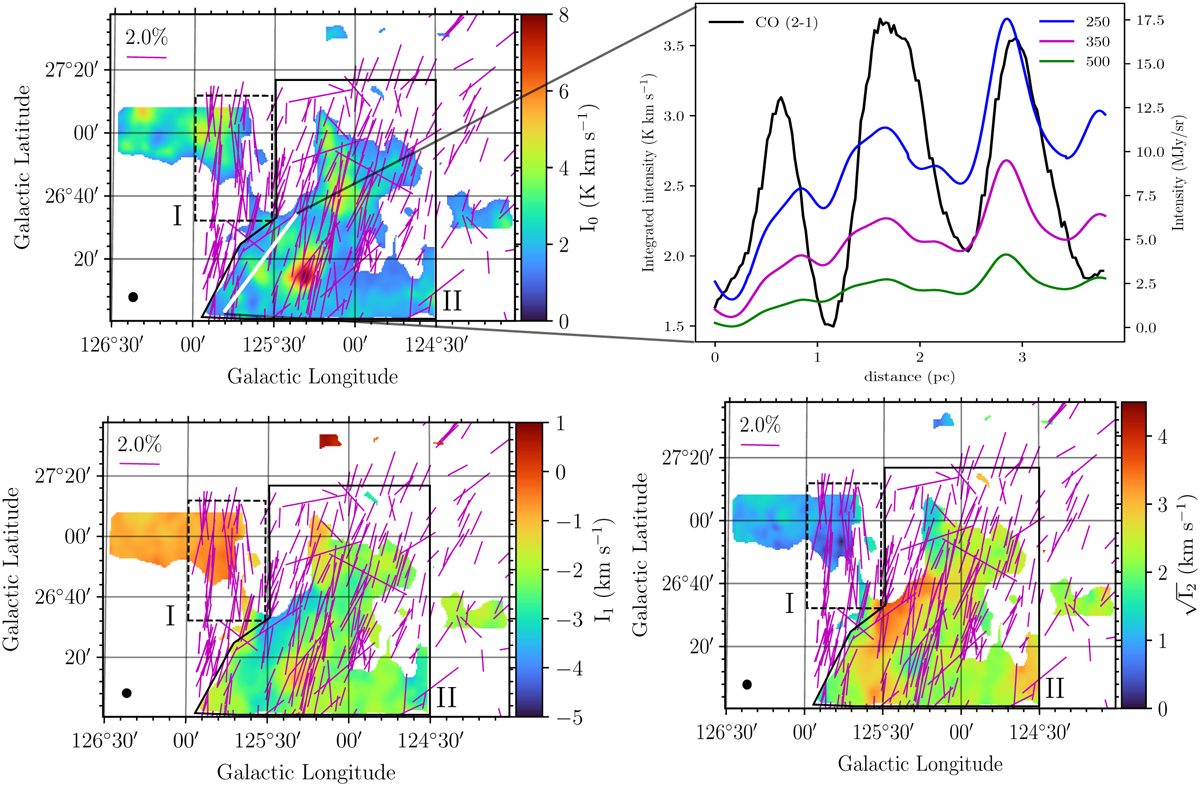
12CO (J = 2−1) moment maps smoothed at a resolution of 2.57′. The circular beam in the left corner of each panel shows the Gaussian kernel used for smoothing the data. Magenta segments show the POS magnetic field orientation as traced by optical dust polarization. A scale segment is shown in the upper left corner in each panel. Pixels with a total CO intensity lower than 1.1 (K km s−1) have been masked out. The dotted black rectangle defines the boundaries of region I, and the solid polygon defines region II. The black labels (I, II) are the region identifiers. Top left panel: Intensity (zero-moment) map of CO. Upper right panel: Intensity profiles along the white line shown in the I0 map. The left vertical axis corresponds to the CO (J = 2−1) integrated intensity. The right vertical axis corresponds to the dust intensity of the three Herschel bands of the SPIRE instrument. The wavelength of each band is shown in the legend. The quasiperiodicity of the CO intensity fluctuations is prominent across this line. The wavelength of the pattern is ~1 pc. Dust intensity profiles are more complex than the CO profile, showing several subparsec features. Bottom left panel: Centroid velocity (I1, first moment) map of CO. Right panel: Velocity dispersion of CO (![]() square root of the second-moment map).
square root of the second-moment map).
Current usage metrics show cumulative count of Article Views (full-text article views including HTML views, PDF and ePub downloads, according to the available data) and Abstracts Views on Vision4Press platform.
Data correspond to usage on the plateform after 2015. The current usage metrics is available 48-96 hours after online publication and is updated daily on week days.
Initial download of the metrics may take a while.