Fig. 4
Download original image
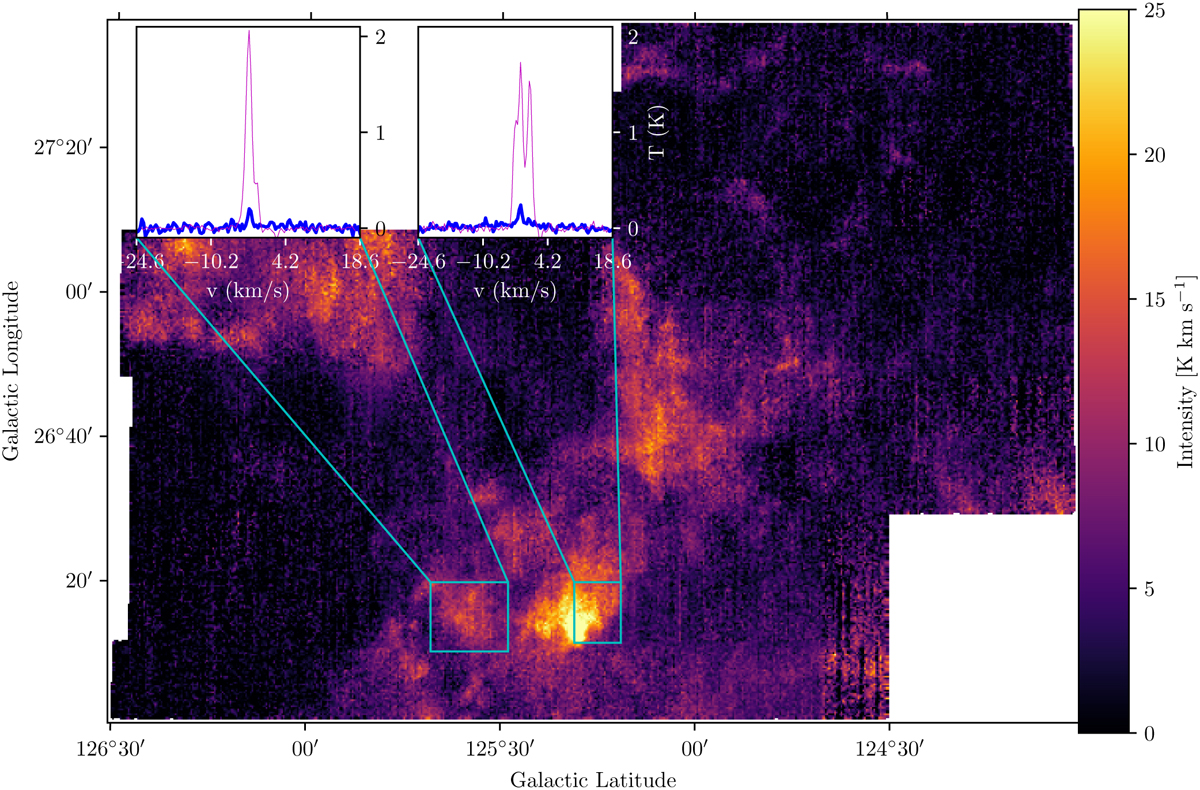
CO integrated intensity moment map at native resolution, without any filtering or masking. Cyan box-shaped regions are defined by the positions at which we detected the 13CO (J = 2−1) line. Inset panels show the mean spectra of 12CO (magenta) and 13CO (blue) within the cyan boxes. The intensity of the 13CO emission is approximately an order of magnitude lower than 12CO.
Current usage metrics show cumulative count of Article Views (full-text article views including HTML views, PDF and ePub downloads, according to the available data) and Abstracts Views on Vision4Press platform.
Data correspond to usage on the plateform after 2015. The current usage metrics is available 48-96 hours after online publication and is updated daily on week days.
Initial download of the metrics may take a while.