Fig. 2
Download original image
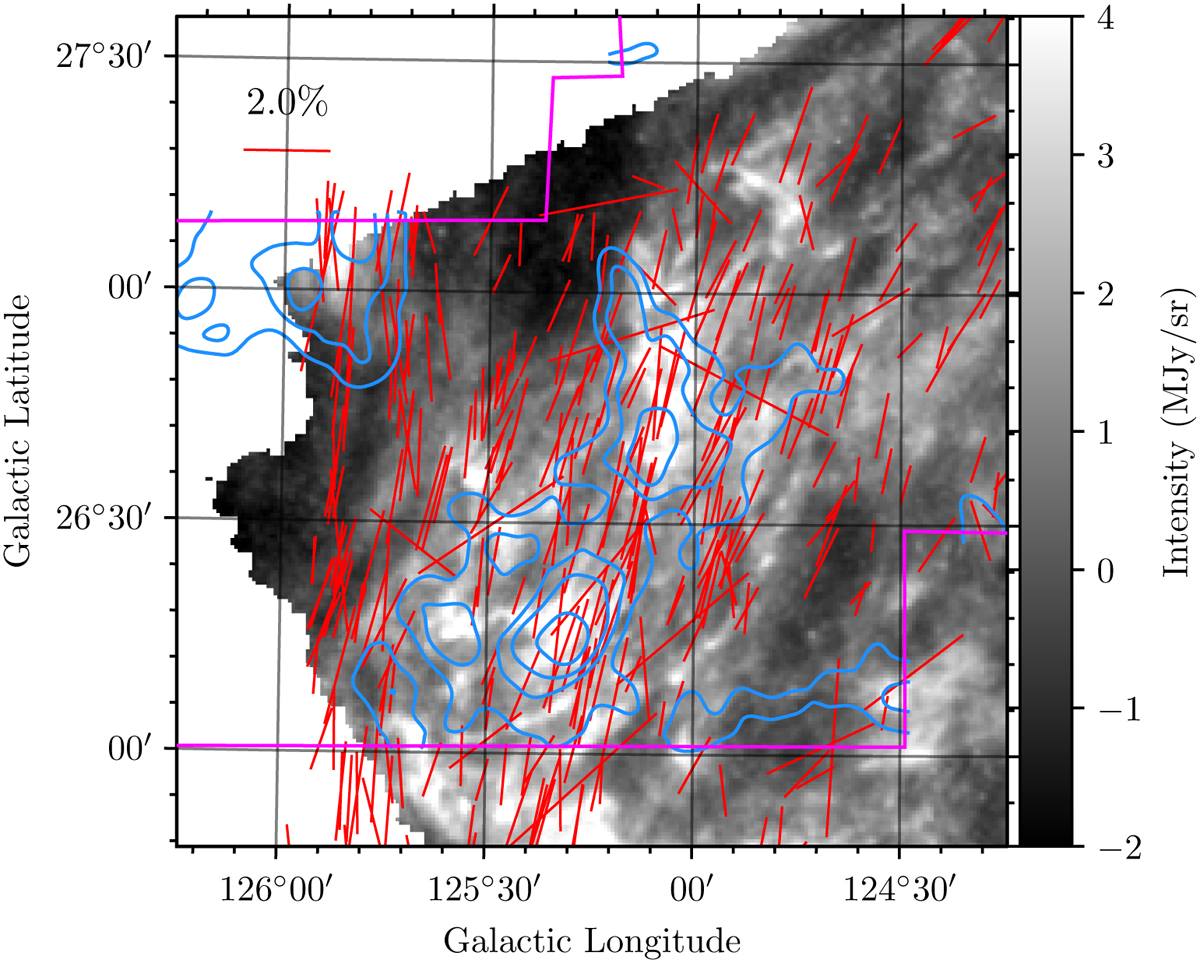
Zoomed-in view toward the striation region. Optical polarization segments (red lines) are overplotted on the dust continuum emission map of the Polaris Flare as observed with Herschel at 500 µm. A line is shown for scale in the top left corner of the figure, corresponding to a degree of polarization of p = 2%. Blue contours correspond to the 12CO integrated intensity as in Fig. 1.
Current usage metrics show cumulative count of Article Views (full-text article views including HTML views, PDF and ePub downloads, according to the available data) and Abstracts Views on Vision4Press platform.
Data correspond to usage on the plateform after 2015. The current usage metrics is available 48-96 hours after online publication and is updated daily on week days.
Initial download of the metrics may take a while.