Open Access
Fig. 1
Download original image
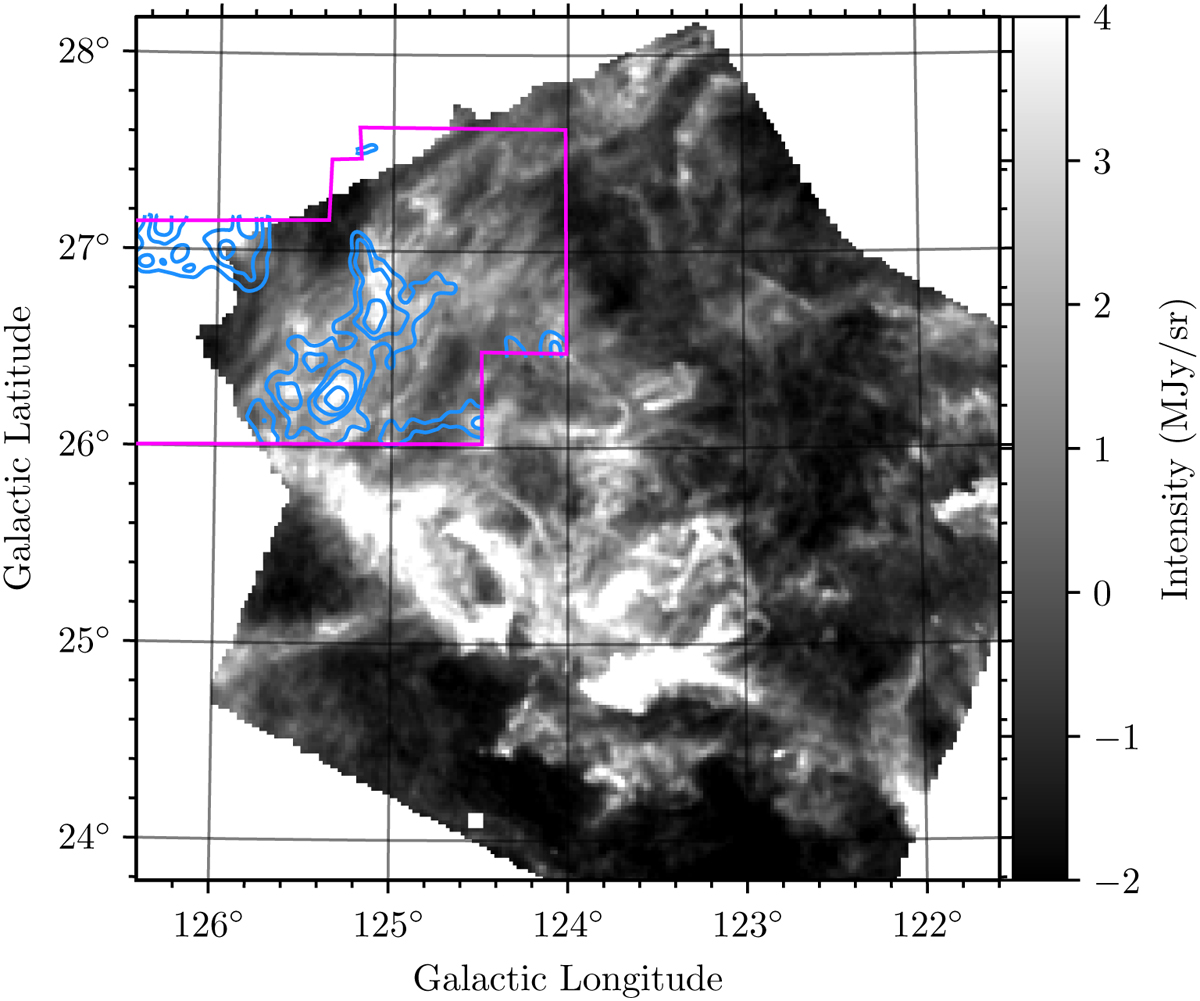
Large-scale view of the Polaris Flare as observed with the Spire instrument of the Herschel observatory at 500 µm. The magenta polygon shows the CO surveyed region, and blue contours show the smoothed integrated CO (J = 2−1) intensity emission at 2.5 and 4 K km s−1.
Current usage metrics show cumulative count of Article Views (full-text article views including HTML views, PDF and ePub downloads, according to the available data) and Abstracts Views on Vision4Press platform.
Data correspond to usage on the plateform after 2015. The current usage metrics is available 48-96 hours after online publication and is updated daily on week days.
Initial download of the metrics may take a while.