Fig. 9.
Download original image
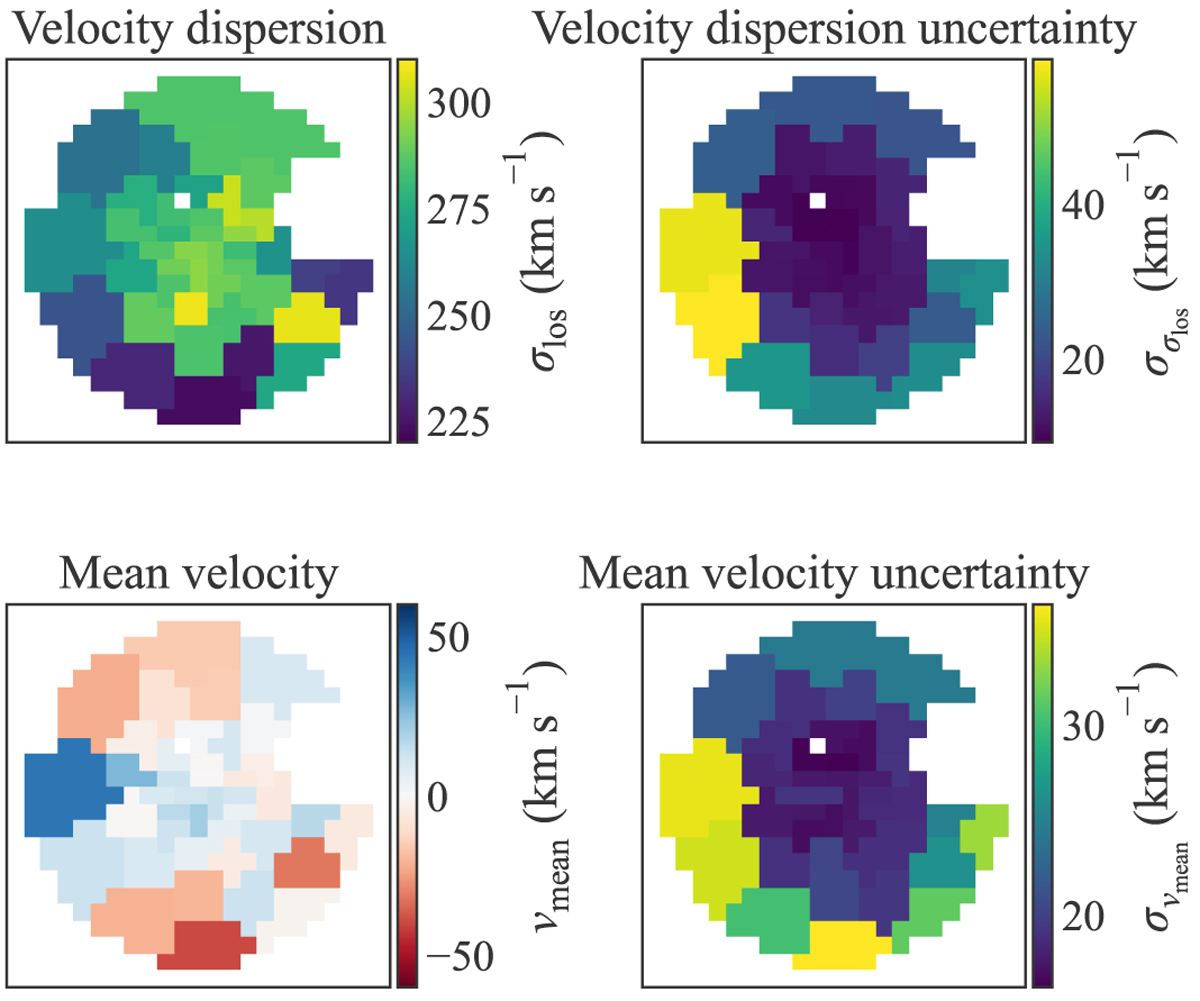
Maps of extracted velocity dispersion (top row) and mean velocity (bottom row) in Voronoi bins along with the corresponding uncertainties (right column). The Voronoi binning was tuned to achieve S/N ≈ 23 Å−1 for each bin. The illustrated maps (left column) correspond to the average values after combining 81 model setups, and the uncertainty maps correspond to the square root of the diagonal of the variance-covariance matrices. A systematic velocity of 182 km s−1 was subtracted from the mean velocity map.
Current usage metrics show cumulative count of Article Views (full-text article views including HTML views, PDF and ePub downloads, according to the available data) and Abstracts Views on Vision4Press platform.
Data correspond to usage on the plateform after 2015. The current usage metrics is available 48-96 hours after online publication and is updated daily on week days.
Initial download of the metrics may take a while.