Fig. 4.

Download original image
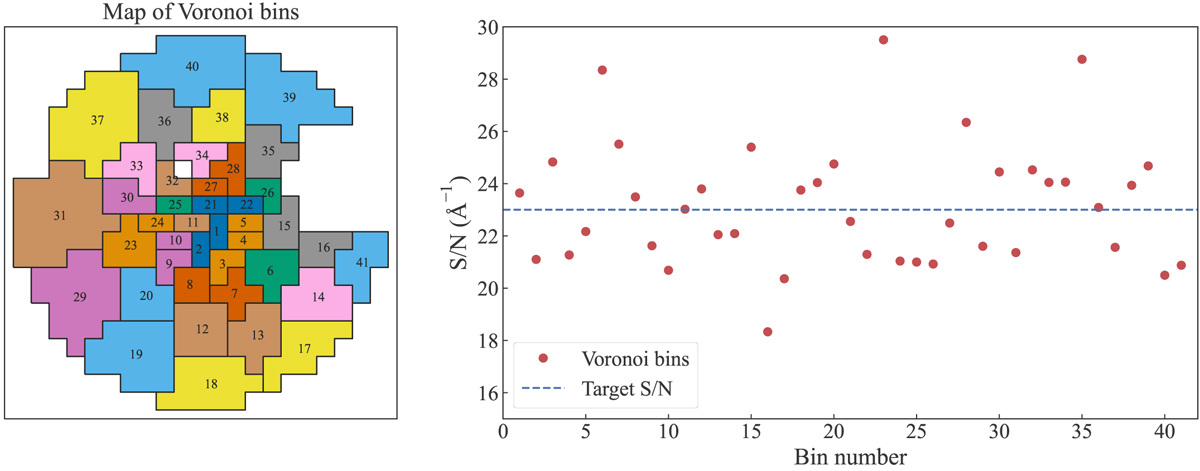
Left: Voronoi binning of the selected spaxels within 1″.5 from the galaxy center that avoid lensed arcs, quasar images, and the satellite galaxy S. The different colors illustrate the regions for each Voronoi bin in a cartographic manner for easier visualization, with the bin number specified within each bin. We perform the binning with a target S/N ≈ 23 Å−1 for each bin, which results in 41 bins in total. Right: resultant S/N for each Voronoi bin (red points).
Current usage metrics show cumulative count of Article Views (full-text article views including HTML views, PDF and ePub downloads, according to the available data) and Abstracts Views on Vision4Press platform.
Data correspond to usage on the plateform after 2015. The current usage metrics is available 48-96 hours after online publication and is updated daily on week days.
Initial download of the metrics may take a while.


