Fig. 21.
Download original image
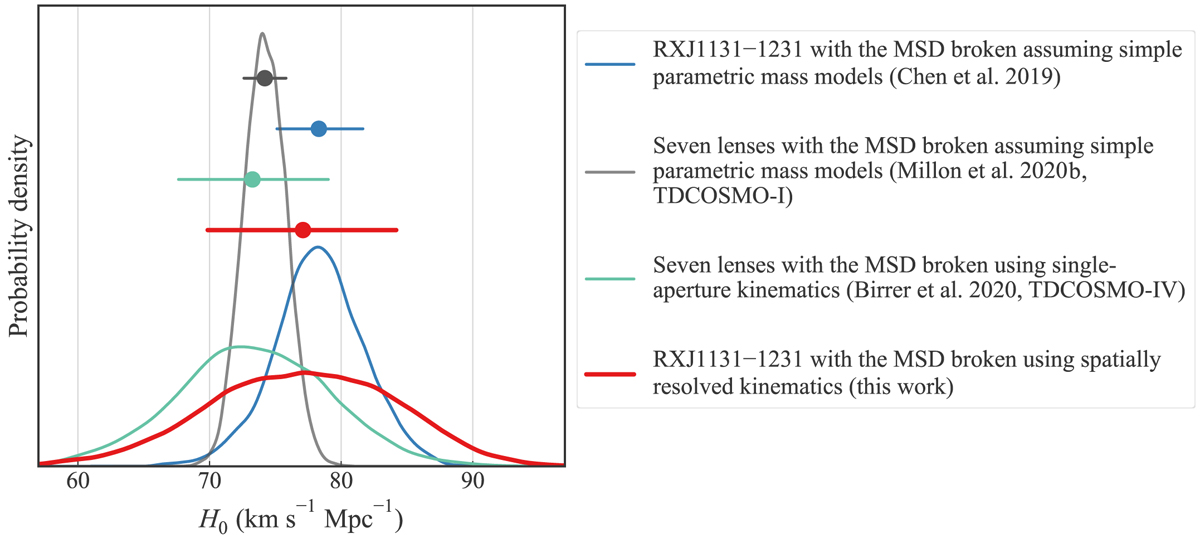
Comparison of our 9.4% H0 measurement (red, ![]() km s−1 Mpc−1) from the single system RXJ1131−1231 with previous measurements from Chen et al. (2019, blue), Millon et al. (2020b, gray), and Birrer et al. (2020, emerald). The distributions show the H0 posteriors as described in the figure legend, and the points with error bars mark the mean and 68% credible intervals of the corresponding posterior with matching color. For the same flexible mass models, our analysis on a single system provides a similar precision on H0 with that from seven lenses with only single-aperture stellar kinematics (emerald,
km s−1 Mpc−1) from the single system RXJ1131−1231 with previous measurements from Chen et al. (2019, blue), Millon et al. (2020b, gray), and Birrer et al. (2020, emerald). The distributions show the H0 posteriors as described in the figure legend, and the points with error bars mark the mean and 68% credible intervals of the corresponding posterior with matching color. For the same flexible mass models, our analysis on a single system provides a similar precision on H0 with that from seven lenses with only single-aperture stellar kinematics (emerald, ![]() km s−1 Mpc−1). Moreover, the median value of our measurement falls very close to those from previous analyses on the same system but with simple parametric assumption on the mass model breaking the MSD (blue,
km s−1 Mpc−1). Moreover, the median value of our measurement falls very close to those from previous analyses on the same system but with simple parametric assumption on the mass model breaking the MSD (blue, ![]() km s−1 Mpc−1, cf. also
km s−1 Mpc−1, cf. also ![]() km s−1 Mpc−1 from Suyu et al. 2014).
km s−1 Mpc−1 from Suyu et al. 2014).
Current usage metrics show cumulative count of Article Views (full-text article views including HTML views, PDF and ePub downloads, according to the available data) and Abstracts Views on Vision4Press platform.
Data correspond to usage on the plateform after 2015. The current usage metrics is available 48-96 hours after online publication and is updated daily on week days.
Initial download of the metrics may take a while.