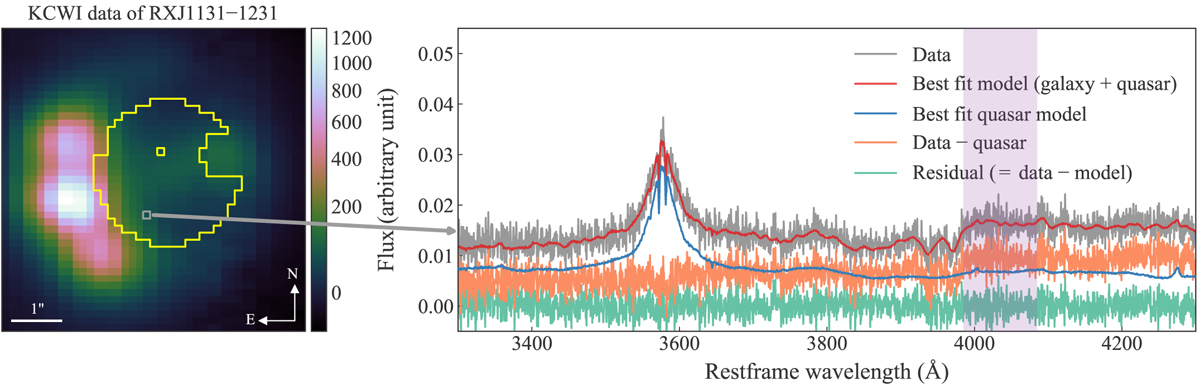
Fig. 2.
Download original image
Illustration of the KCWI data for RXJ1131−1231. Left: 2D representation (summed across wavelength) of the 3D KCWI datacube. The yellow contour traces the region with 1″.5 radial extent from the center selected for stellar kinematic measurement. A circular region with 0″.5 radius around image D and the spaxel containing the satellite S are excluded from this selected region. All the individual spaxels within this region have continuum S/N > 1.4 Å−1 for the lens galaxy’s light within 3985−4085 Å (the purple shaded range in the right panel). Right: the spectra (gray) from an example pixel (gray box in the left panel) and the estimate of the signal from the lens galaxy’s spectra (orange) after removing the contribution from the quasar light (blue). The full model of the spectra is presented with the red line, and the model’s residual is plotted in emerald color. The vertical purple shaded region marks where we compute the continuum S/N.
Current usage metrics show cumulative count of Article Views (full-text article views including HTML views, PDF and ePub downloads, according to the available data) and Abstracts Views on Vision4Press platform.
Data correspond to usage on the plateform after 2015. The current usage metrics is available 48-96 hours after online publication and is updated daily on week days.
Initial download of the metrics may take a while.