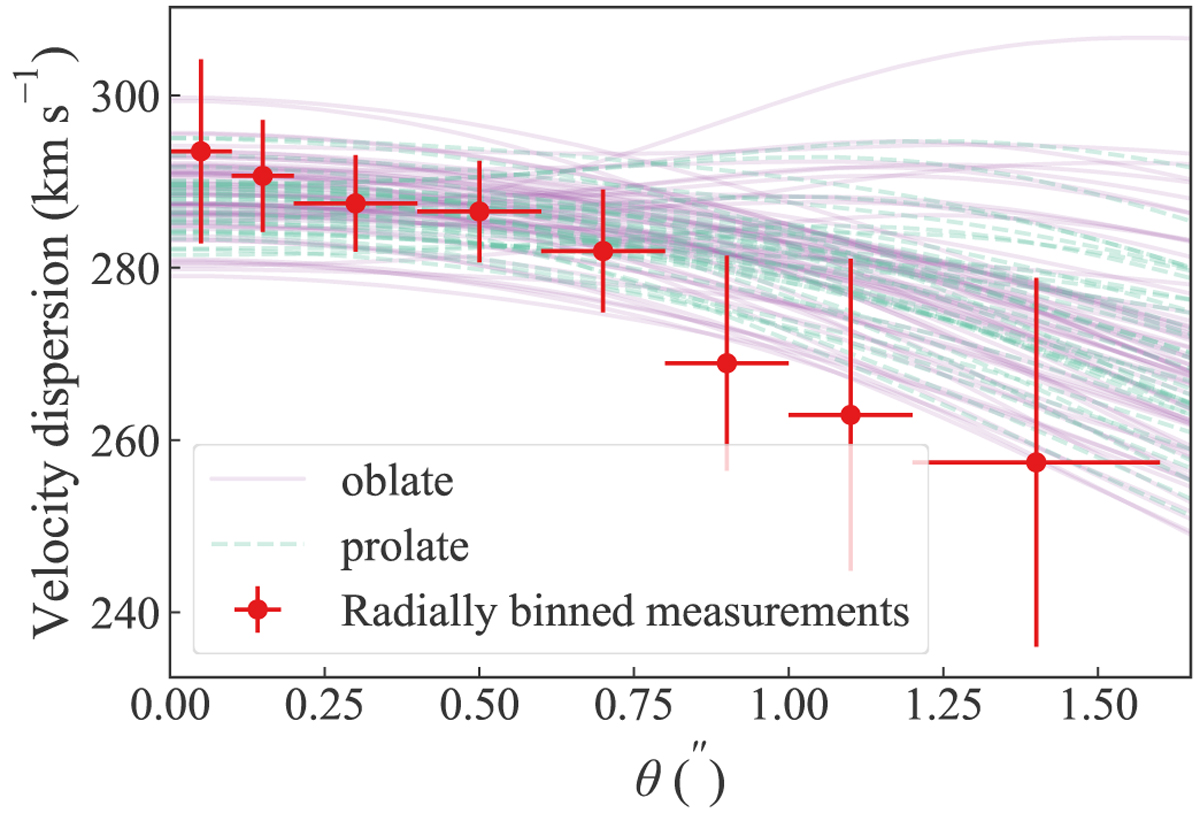
Fig. 16.
Download original image
Radial profile of the line-of-sight velocity dispersion. The red points are radially binned values from the 2D maps, with the horizontal error bars illustrating the widths of the annuli. The lines show the radial profiles for random samples from the dynamical model posterior. The radial profile of the model is averaged over the major, minor, and intermediate axes. The solid purple lines correspond to 65 random samples for the oblate case, and the dashed green lines correspond to 35 random samples for the prolate case. We note that the model was fit to the 2D kinematics data. However, we illustrate the 1D radial profile only for visualization.
Current usage metrics show cumulative count of Article Views (full-text article views including HTML views, PDF and ePub downloads, according to the available data) and Abstracts Views on Vision4Press platform.
Data correspond to usage on the plateform after 2015. The current usage metrics is available 48-96 hours after online publication and is updated daily on week days.
Initial download of the metrics may take a while.