Fig. 15.
Download original image
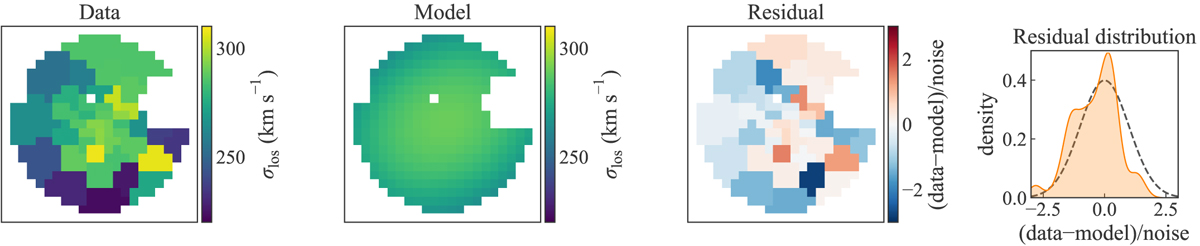
Observed velocity dispersion map in Voronoi bins (first panel), the best-fit dynamical model with a power-law mass model, constant β anisotropy profile, and oblate shape (second panel), the normalized residual for the best-fit dynamical model (third panel), and the distribution of the normalized residual (orange, fourth panel). The reduced χ2 quantity is ![]() with degrees of freedom ν = 41. The gray dashed line in the fourth panel shows a normal distribution expected for residuals from a perfect model to the data with Gaussian noise. The residual distribution for 41 points is similar to this Gaussian distribution.
with degrees of freedom ν = 41. The gray dashed line in the fourth panel shows a normal distribution expected for residuals from a perfect model to the data with Gaussian noise. The residual distribution for 41 points is similar to this Gaussian distribution.
Current usage metrics show cumulative count of Article Views (full-text article views including HTML views, PDF and ePub downloads, according to the available data) and Abstracts Views on Vision4Press platform.
Data correspond to usage on the plateform after 2015. The current usage metrics is available 48-96 hours after online publication and is updated daily on week days.
Initial download of the metrics may take a while.