Fig. 11.
Download original image
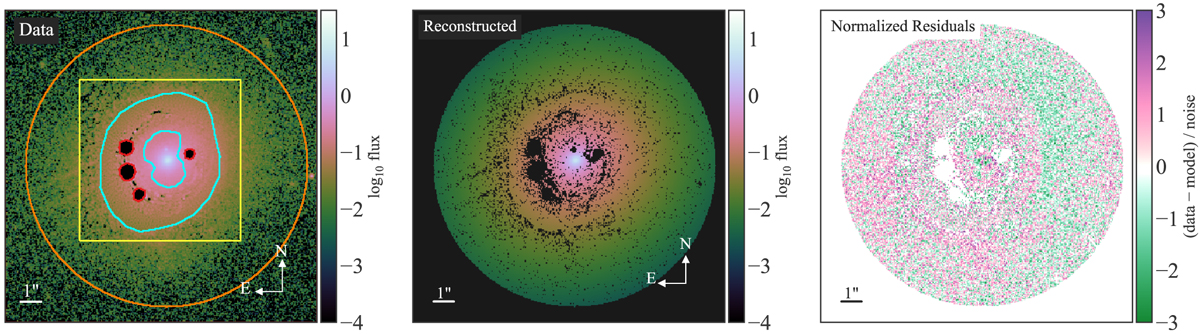
Fit of the lens galaxy’s surface brightness profile. Left: the HST/ACS imaging in the F814W filter of the lens system RXJ1131−1231 with the quasar images and the lensed arcs subtracted using the prediction from the best-fit lens model from Suyu et al. (2013), thus leaving only the lens galaxy’s light to be fitted. The orange circle shows the large circular region considered for fitting in our analysis, and the yellow square shows the smaller cutout used for lens modeling by Suyu et al. (2013). The cyan annulus contains the region where pixels were fitted to reconstruct the source by Suyu et al. (2013). Thus the lensed arcs from the quasar host galaxy were subtracted only within this annulus. The red contours mark quasar image positions with significant residuals due to saturated pixels, which we mask. Middle: the fitted light profile with a double Sérsic model. The black pixels correspond to masked pixels. The additional masked pixels within the orange circle not described above are randomly selected through an iterative process that performs outlier rejection while preserving the Gaussian tail (Sect. 5.1.2 for details). Right: normalized residual of the best-fit model.
Current usage metrics show cumulative count of Article Views (full-text article views including HTML views, PDF and ePub downloads, according to the available data) and Abstracts Views on Vision4Press platform.
Data correspond to usage on the plateform after 2015. The current usage metrics is available 48-96 hours after online publication and is updated daily on week days.
Initial download of the metrics may take a while.