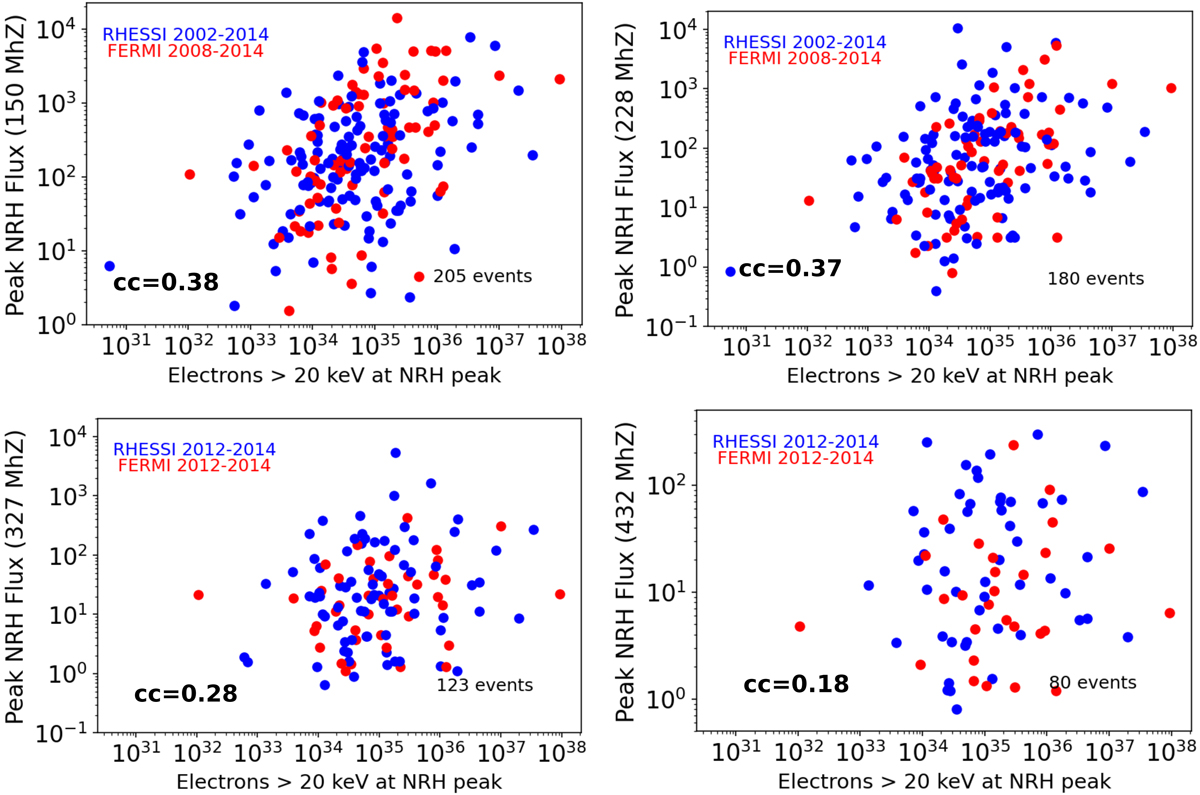
Fig. 9.

Download original image
Scatter plot of the type III radio flux at four frequencies versus non-thermal HXR-producing electrons above 20 keV. The number of events for which type III emissions were detected at higher frequencies is indicated and is observed to progressively decrease. The blue points indicate the events that were observed by RHESSI and the red points are the events that were observed by Fermi GBM. Correlation coefficients are 0.38, 0.37, 0.28, and 0.18 for radio frequencies 164 MHz, 228 MHz, 327 MHz, and 432 MHz, respectively.
Current usage metrics show cumulative count of Article Views (full-text article views including HTML views, PDF and ePub downloads, according to the available data) and Abstracts Views on Vision4Press platform.
Data correspond to usage on the plateform after 2015. The current usage metrics is available 48-96 hours after online publication and is updated daily on week days.
Initial download of the metrics may take a while.


