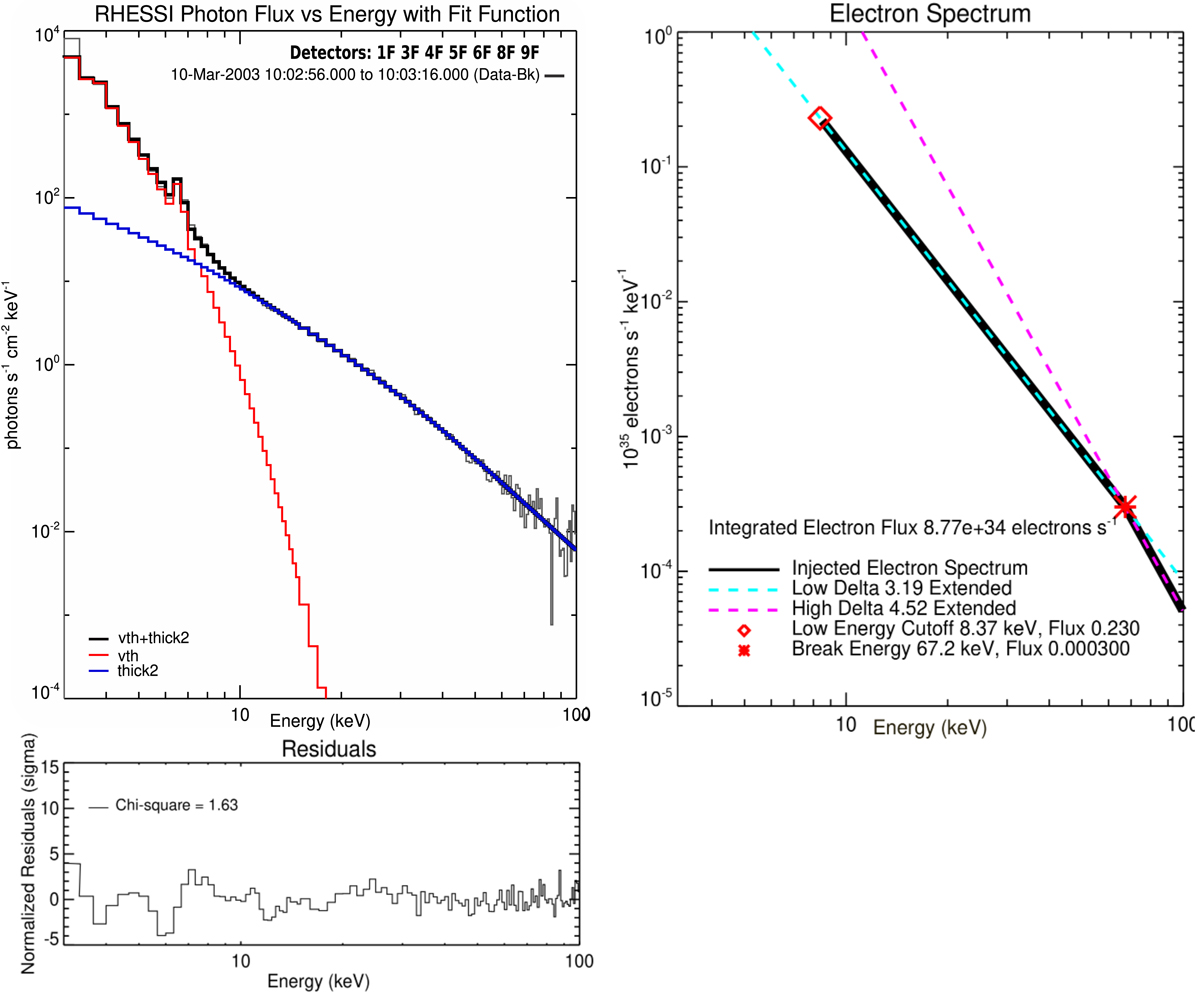
Fig. 7.
Download original image
HXR spectral analysis. Left: RHESSI HXR spectrum and fit for the event that occurred on 10 March 2003 (Fig. 1). The figure shows the background-subtracted peak photon spectrum (solid black histogram) overlaid by the total (vth+thick2) spectral fit (light grey line). The red and blue lines show the thermal and the non-thermal components, respectively. Right: non-thermal electron flux deduced from the fit. The integrated electron flux is computed here above the low-energy cutoff 8.37 keV. Bottom: Normalised fit residual as a function of energy.
Current usage metrics show cumulative count of Article Views (full-text article views including HTML views, PDF and ePub downloads, according to the available data) and Abstracts Views on Vision4Press platform.
Data correspond to usage on the plateform after 2015. The current usage metrics is available 48-96 hours after online publication and is updated daily on week days.
Initial download of the metrics may take a while.