Fig. 3.
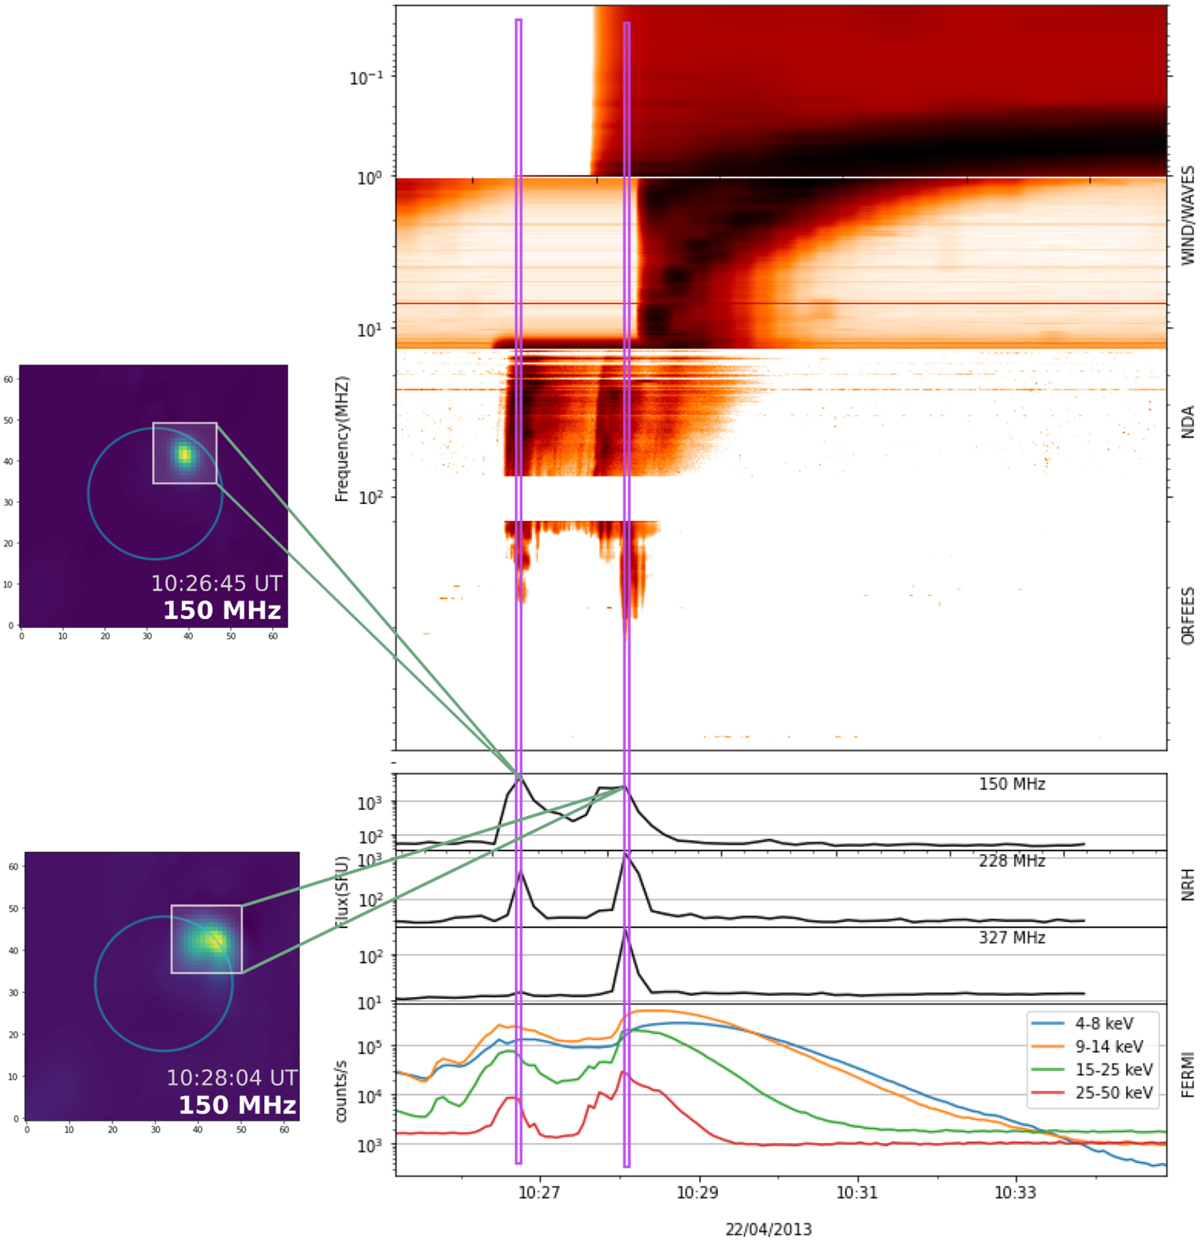
Download original image
Same as Fig. 2, but for the event selected on 22 April 2013. The radio spectrograph for frequencies above 100 MHz is from ORFEES. Two events were selected and considered in the study during the period plotted. The positions of the type III sources at 150 MHz for the two events are plotted on the left. The white box in the top figure is due to a data gap in the RAD2 instrument.
Current usage metrics show cumulative count of Article Views (full-text article views including HTML views, PDF and ePub downloads, according to the available data) and Abstracts Views on Vision4Press platform.
Data correspond to usage on the plateform after 2015. The current usage metrics is available 48-96 hours after online publication and is updated daily on week days.
Initial download of the metrics may take a while.