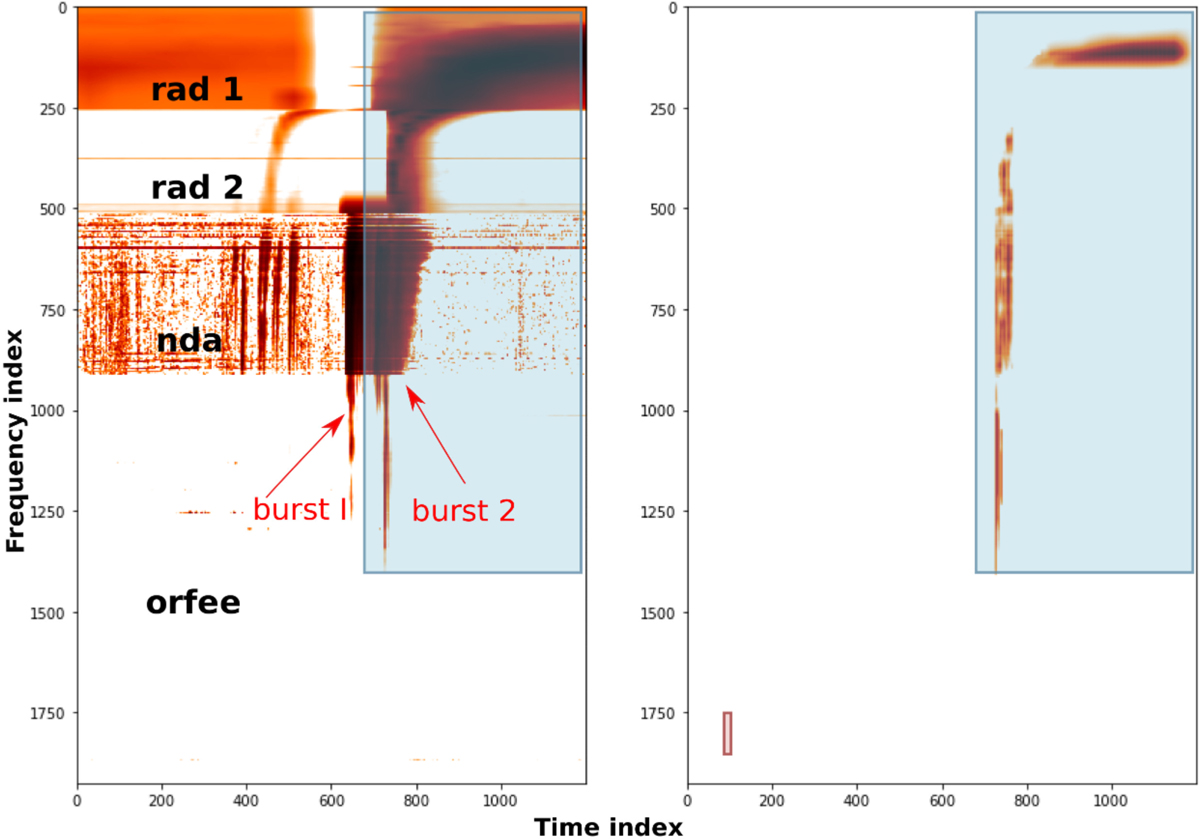
Fig. A.1.
Download original image
Burst extraction algorithm in action for an event on 22 April 2013. On the left-hand side, the primary data are plotted. We note that there are two bursts in the present figure but that the extraction is shown here for the second burst (blue bounding box). The figure on the right shows the pixelised representation of the second type III burst, once the algorithm had been applied. The starting and stopping frequencies were found to be 374 MHz and 0.24 MHz, respectively.
Current usage metrics show cumulative count of Article Views (full-text article views including HTML views, PDF and ePub downloads, according to the available data) and Abstracts Views on Vision4Press platform.
Data correspond to usage on the plateform after 2015. The current usage metrics is available 48-96 hours after online publication and is updated daily on week days.
Initial download of the metrics may take a while.