Open Access
Fig. 10.
Download original image
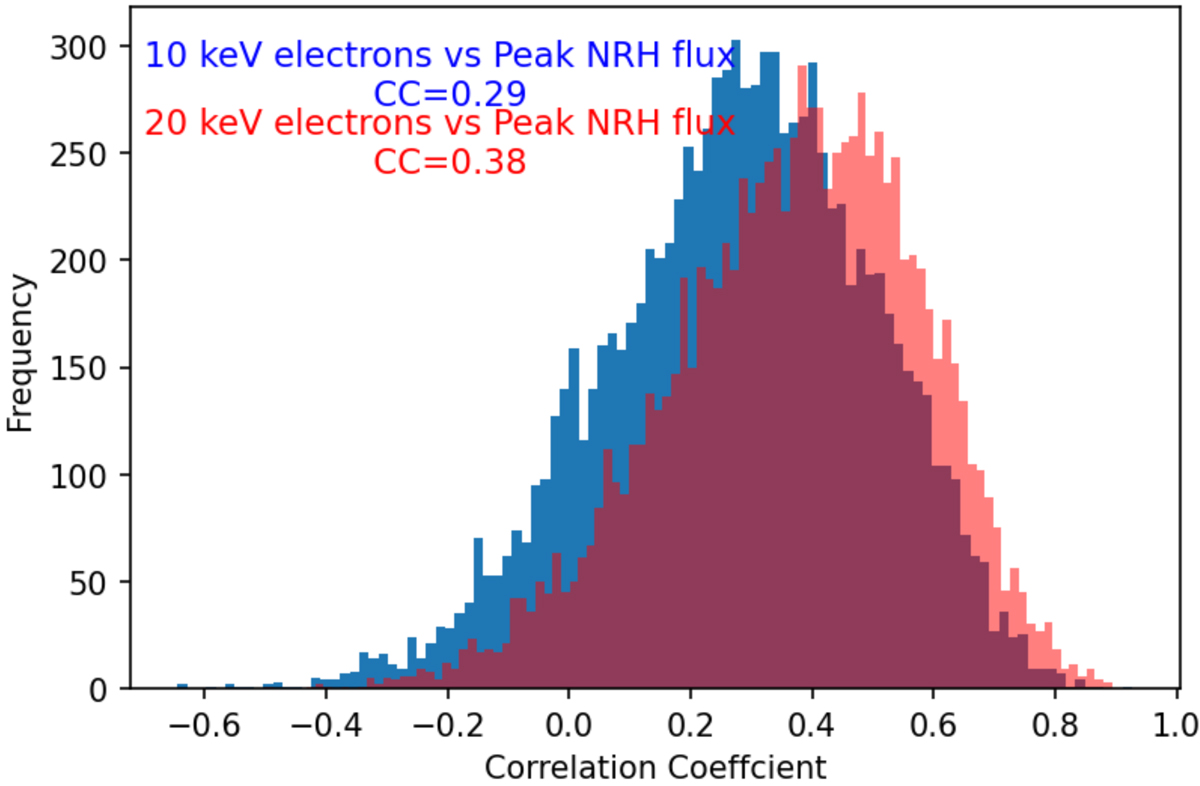
Frequency distribution of correlation coefficient between the type III peak radio flux at 150 MHz and the number of electrons above 10 and 20 keV. The blue distribution corresponds to 10 keV electrons while the red distribution corresponds to 20 keV electrons. We conducted 10 000 trials with 30 data points per sample.
Current usage metrics show cumulative count of Article Views (full-text article views including HTML views, PDF and ePub downloads, according to the available data) and Abstracts Views on Vision4Press platform.
Data correspond to usage on the plateform after 2015. The current usage metrics is available 48-96 hours after online publication and is updated daily on week days.
Initial download of the metrics may take a while.