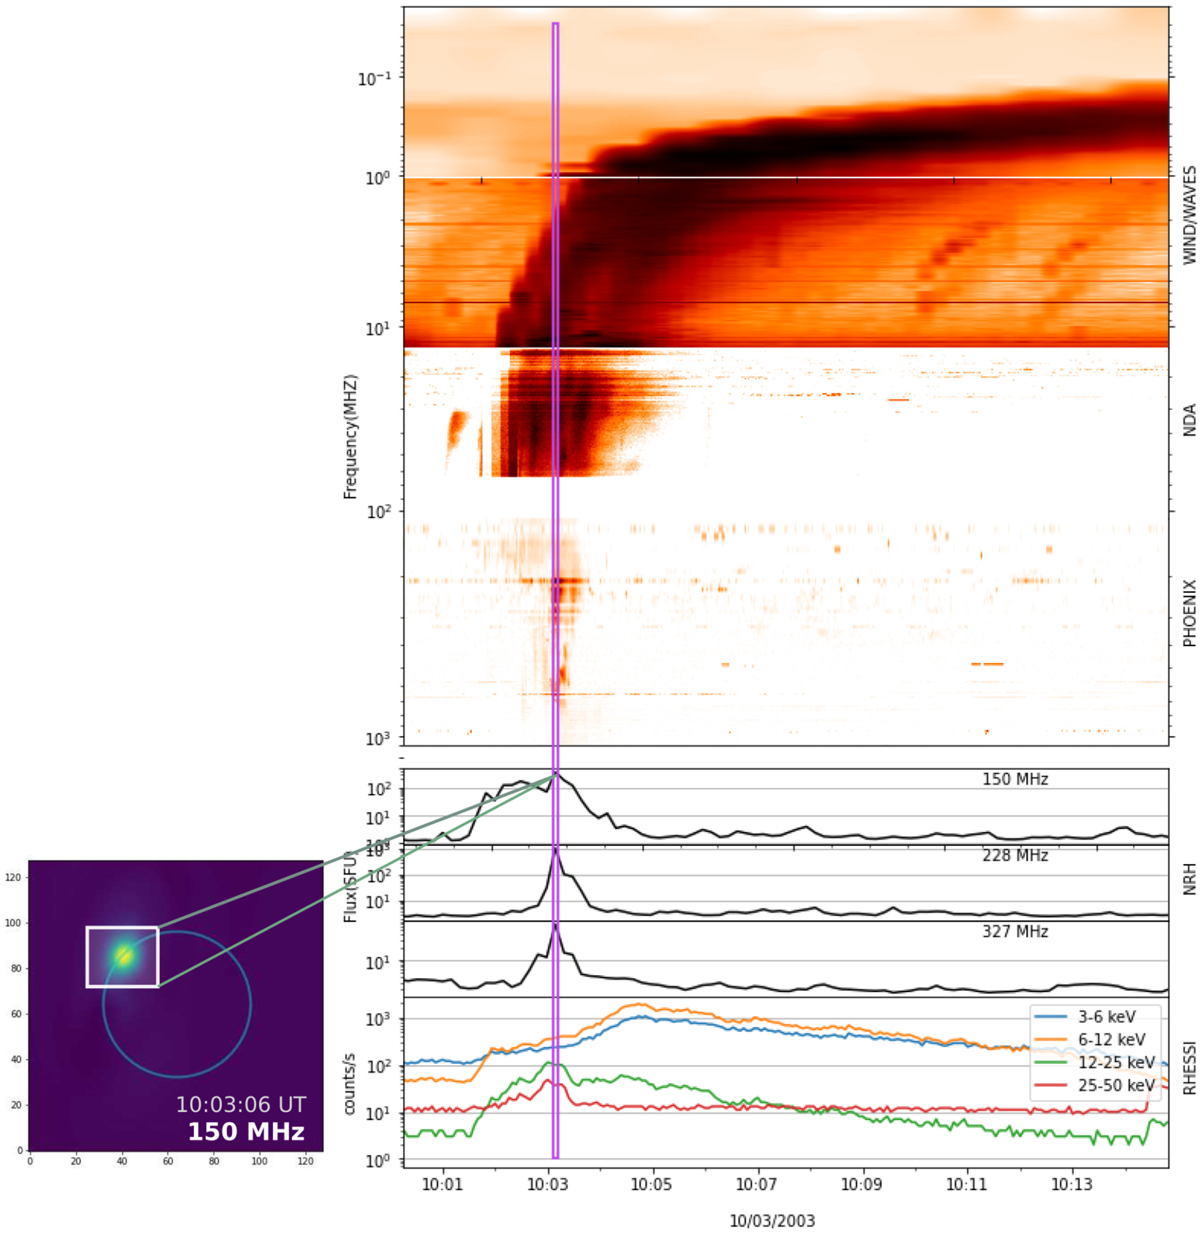
Fig. 1.
Download original image
Time profile of a selected event on 10 March 2003. From bottom to top: time profile of the X-ray count rates (corrected from attenuator states) observed with RHESSI in four energy bands (3–6 keV, 6–12 keV, 12–25 keV, and 25–50 keV); time profile of the NRH radio flux at three frequencies (327 MHz, 228 MHz, and 150 MHz) computed on the squared region shown in the insert on the left; and a combination of radio spectrograms in the 1 GHz–20 kHz range obtained with PHOENIX-2 for frequencies above 100 MHz, NDA for frequencies between 10 and 80 MHz, and WIND/WAVES for frequencies below 10 MHz. Insert on the left: position of the type III radio source at the time of the 150 MHz peak. The blue circle represents the position of the optical solar limb and the square shows the region for which the radio flux was computed.
Current usage metrics show cumulative count of Article Views (full-text article views including HTML views, PDF and ePub downloads, according to the available data) and Abstracts Views on Vision4Press platform.
Data correspond to usage on the plateform after 2015. The current usage metrics is available 48-96 hours after online publication and is updated daily on week days.
Initial download of the metrics may take a while.