Fig. 7
Download original image
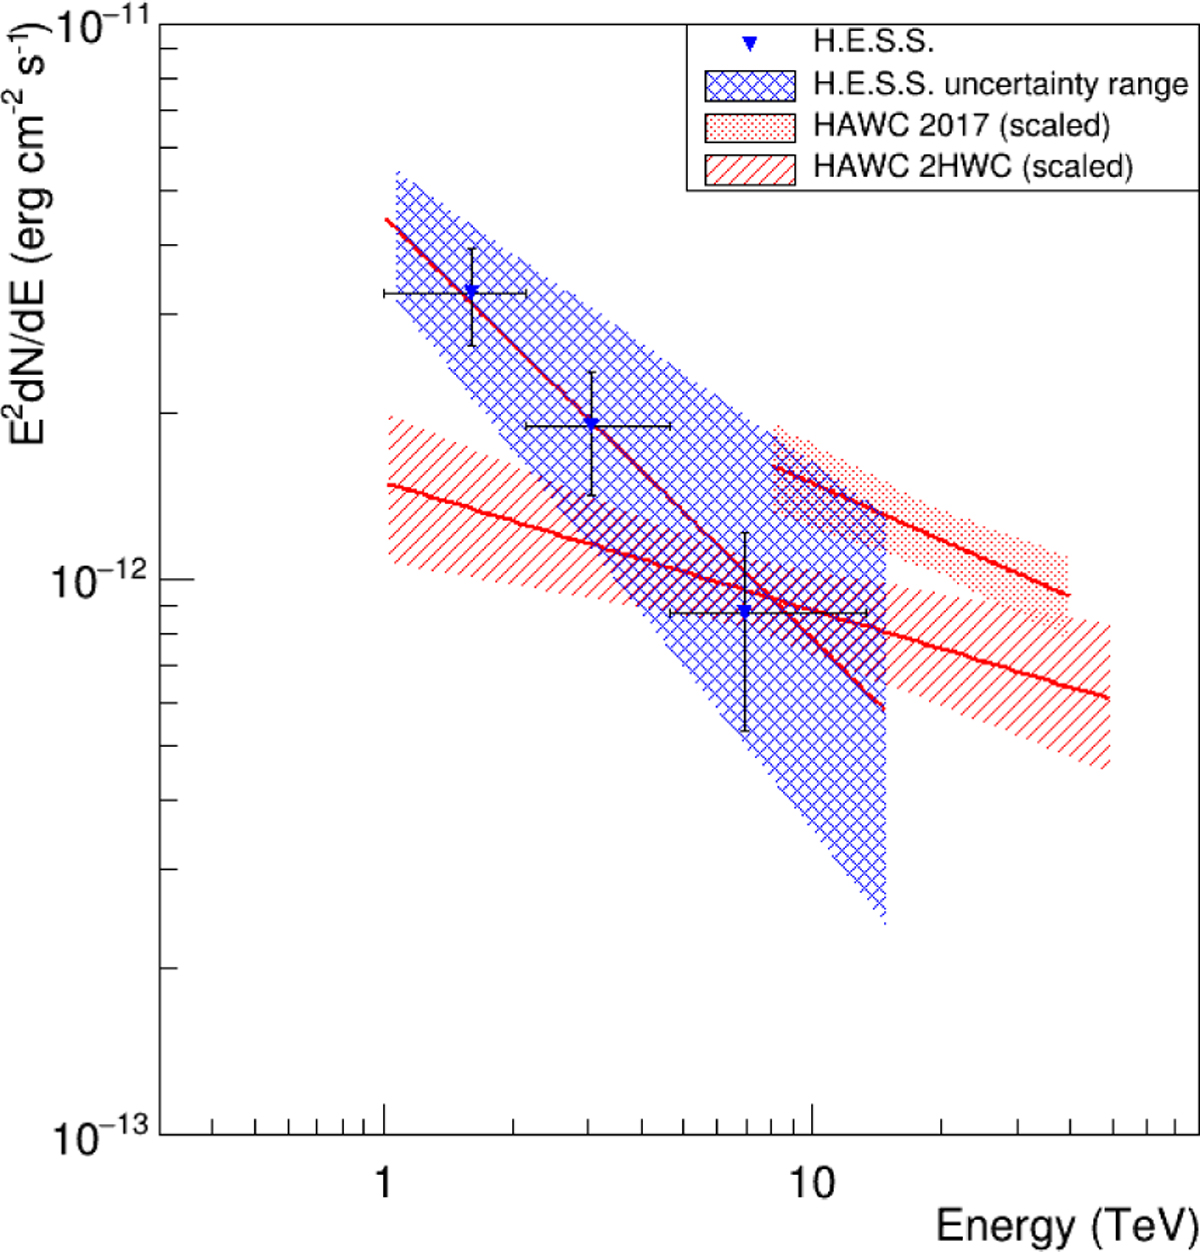
Spectral energy distribution of the γ-ray emission within 1° radius of the Geminga pulsar. Spectra from two HAWC analyses of Geminga are shown for comparison (Abeysekara et al. 2017a,b), with flux normalisation scaled to match the sub-region from which the H.E.S.S. spectrum is extracted. Error bands include systematic uncertainties for H.E.S.S. but are statistical only for HAWC.
Current usage metrics show cumulative count of Article Views (full-text article views including HTML views, PDF and ePub downloads, according to the available data) and Abstracts Views on Vision4Press platform.
Data correspond to usage on the plateform after 2015. The current usage metrics is available 48-96 hours after online publication and is updated daily on week days.
Initial download of the metrics may take a while.