Fig. 3
Download original image
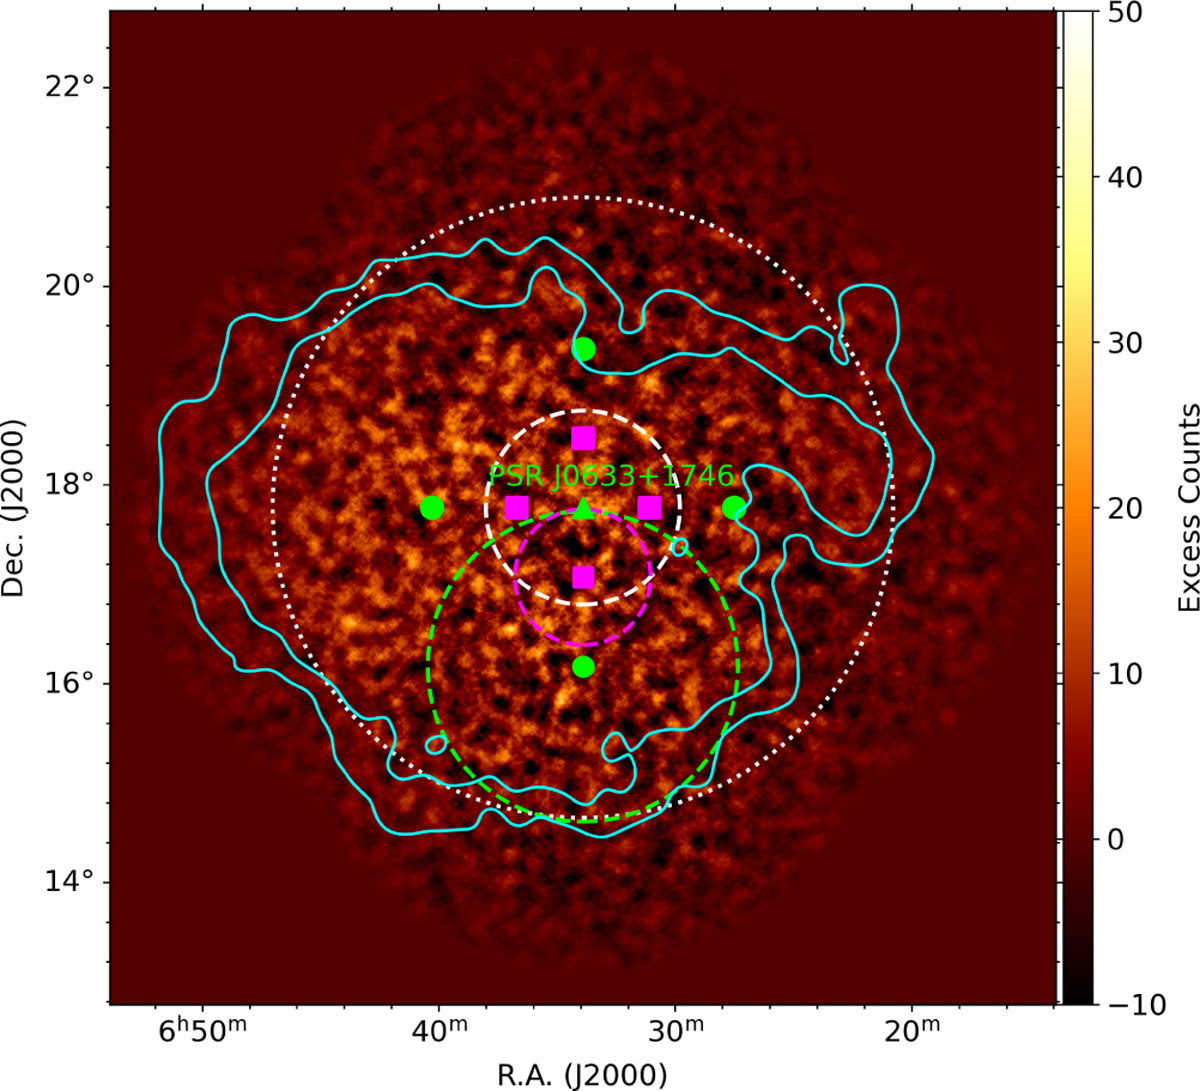
Observation positions corresponding to the 2006–2008 data set (magenta) and the 2019 dataset (green) at offsets of 0.7° and 1.6° from the pulsar respectively. The white dashed circle indicates the test On region with 1° radius around the pulsar, whilst the white dotted circle indicates the 3.2° radius region beyond which the background is normalised. Green and magenta circles indicate the radius around an observation position with the same offset as the pulsar. Counts map and contours are otherwise as in Fig. 2, left.
Current usage metrics show cumulative count of Article Views (full-text article views including HTML views, PDF and ePub downloads, according to the available data) and Abstracts Views on Vision4Press platform.
Data correspond to usage on the plateform after 2015. The current usage metrics is available 48-96 hours after online publication and is updated daily on week days.
Initial download of the metrics may take a while.