Fig. 2
Download original image
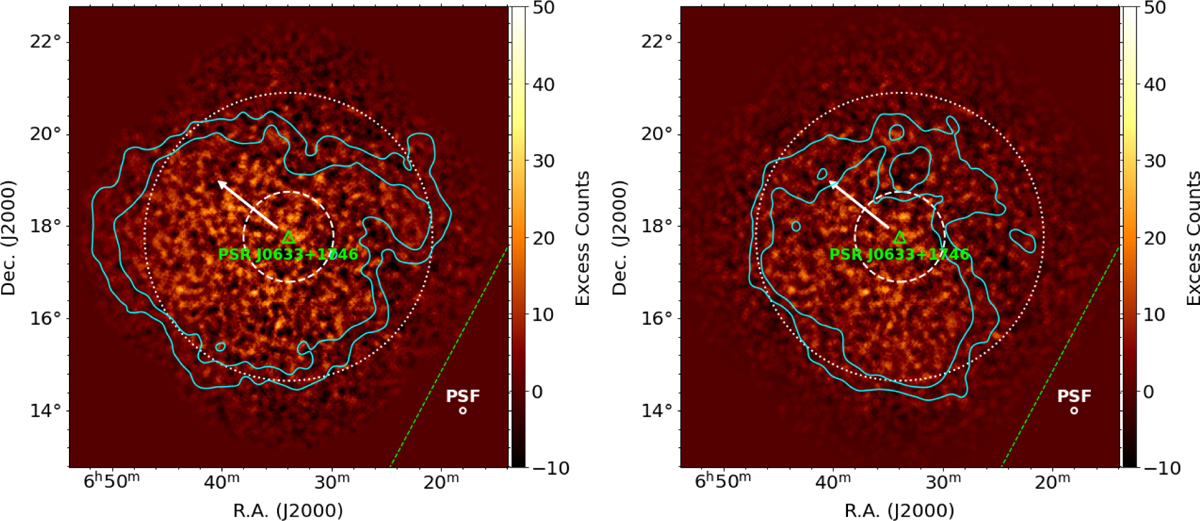
Excess counts sky maps of the Geminga region above 0.5 TeV using the 2019 dataset with two different background estimation methods. Left: On-Off background estimation method. Right: field-of-view background estimation method. The maps are over-sampled with a 0.08º correlation radius, with contours at the level of 50 and 100 excess counts from maps over-sampled with a 0.5° correlation radius. The 68% containment PSF is shown for comparison and has a value of 0.06º, valid for the innermost θ < 1° region around the pulsar in which the significance is evaluated (indicated by a dashed circle). The Galactic plane is indicated by a green dashed line and the pulsar location with a green triangle, whilst an arrow indicates the proper motion direction of the pulsar (arbitrary length). Background normalisation is performed using regions at θ > 3.2°, indicated by a dotted circle.
Current usage metrics show cumulative count of Article Views (full-text article views including HTML views, PDF and ePub downloads, according to the available data) and Abstracts Views on Vision4Press platform.
Data correspond to usage on the plateform after 2015. The current usage metrics is available 48-96 hours after online publication and is updated daily on week days.
Initial download of the metrics may take a while.