Fig. 14
Download original image
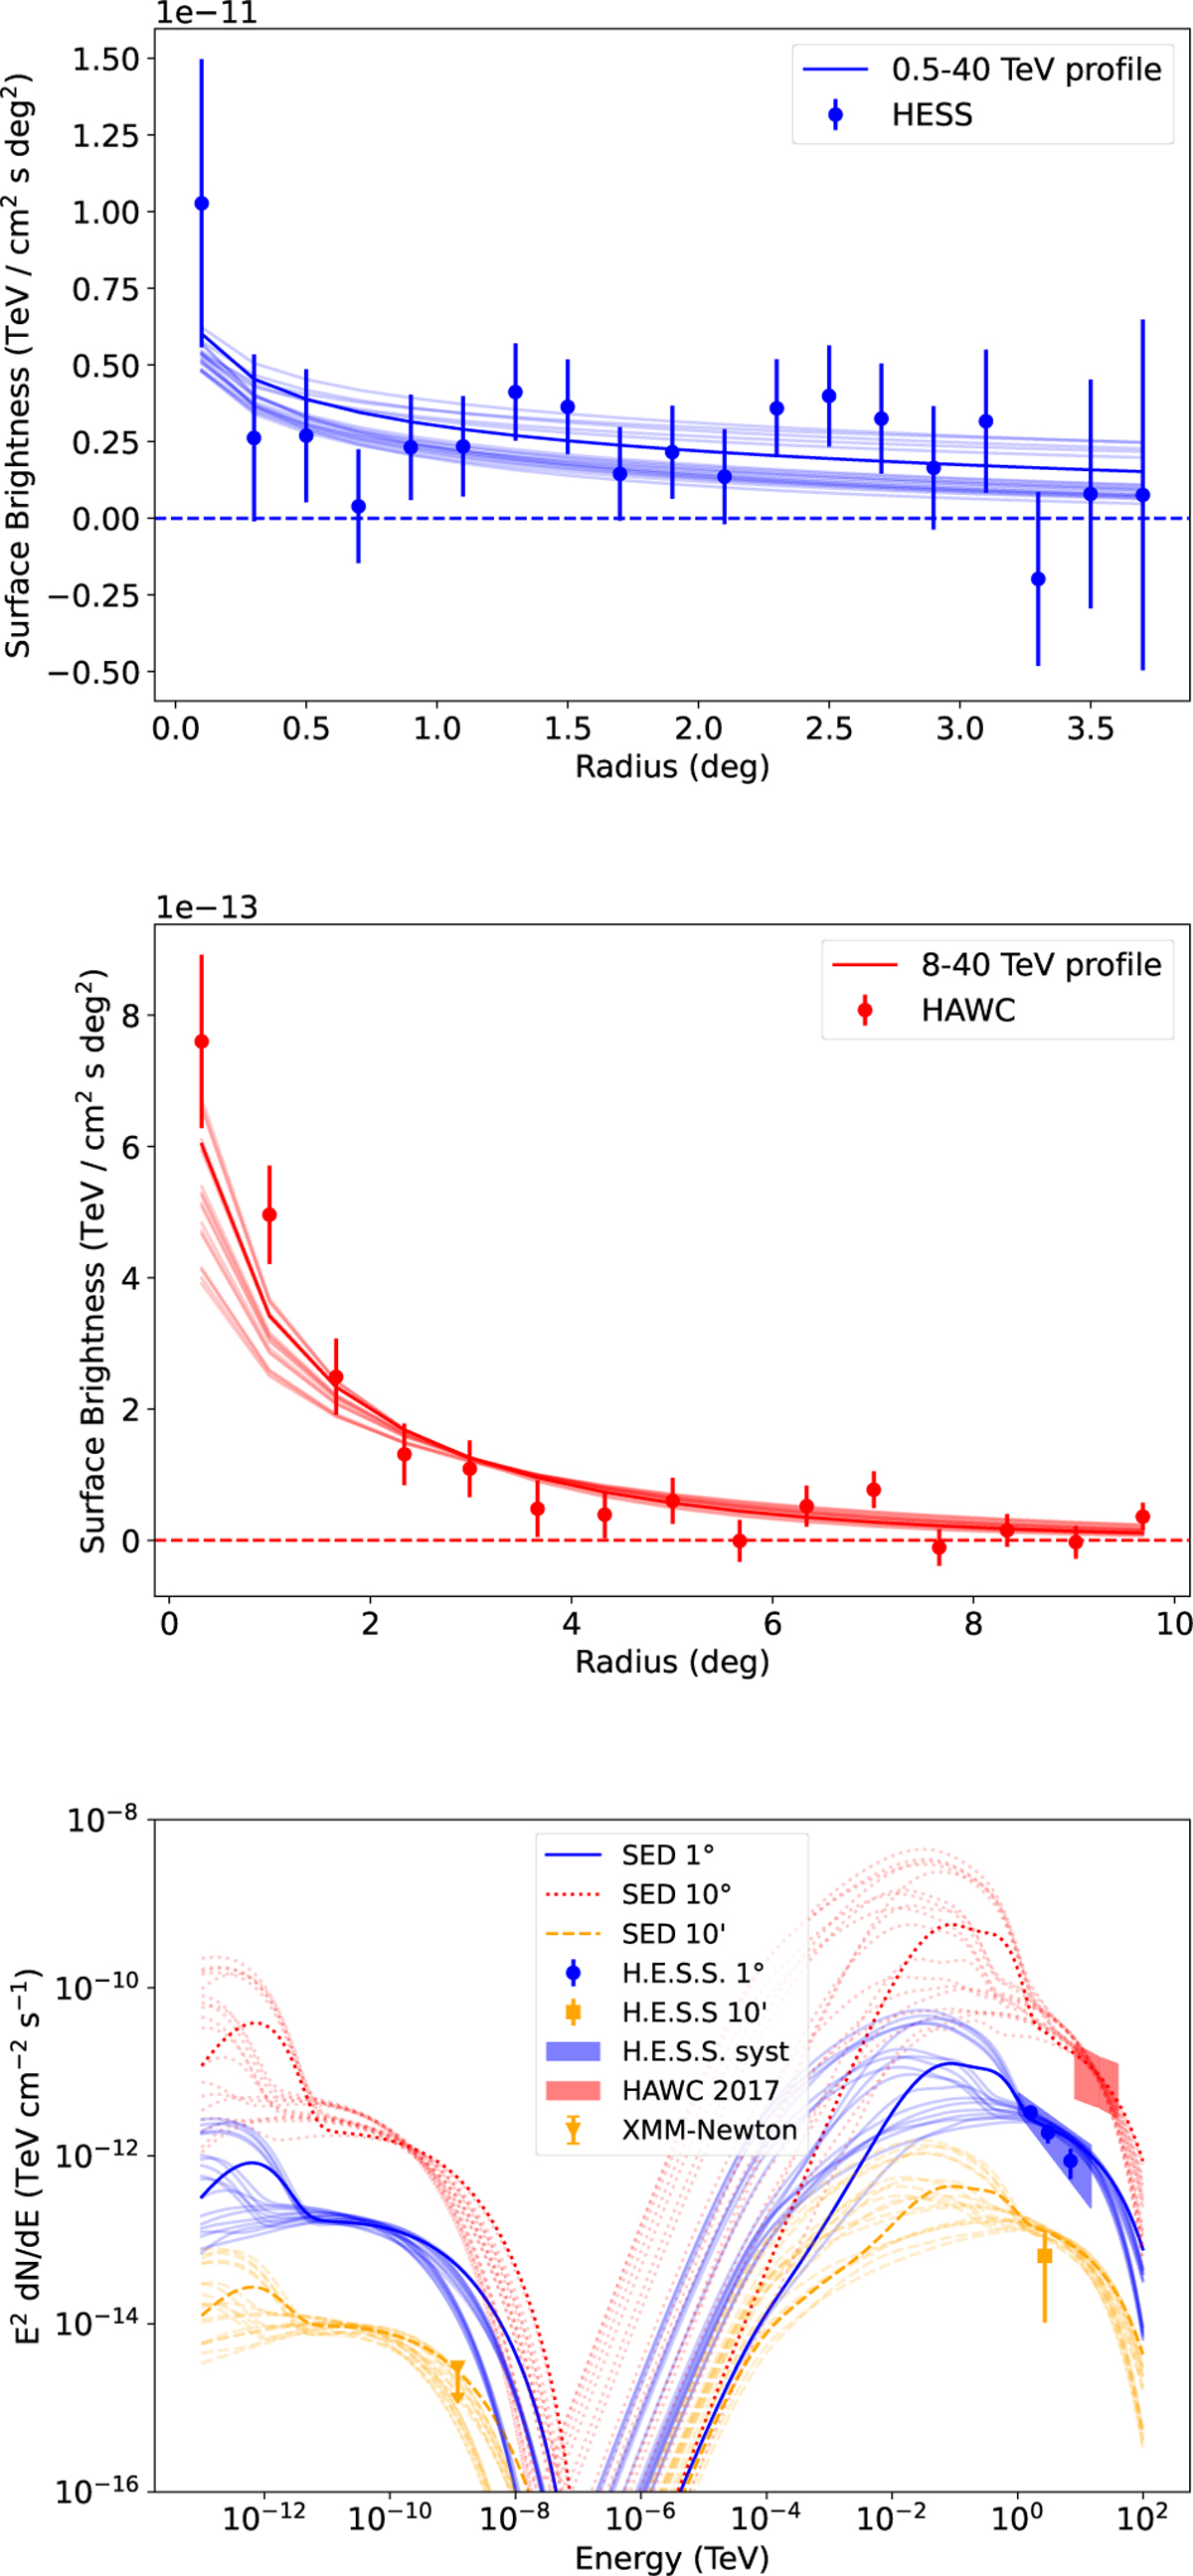
Comparison of the fitted SED and profiles with data for the models with p-value >0.003. The best fit is obtained for n = 4.5, η = 0.1, α = 1.8, δ = 1.0, B = 1 µG and is highlighted compared to other models, with fitted parameters of ![]() cm2 s−1 and
cm2 s−1 and ![]() TeV. The uncertainty bands for H.E.S.S. indicates the systematic uncertainty with statistical uncertainties indicated by the error bars, while for HAWC the uncertainty band represents the systematic and statistical uncertainty.
TeV. The uncertainty bands for H.E.S.S. indicates the systematic uncertainty with statistical uncertainties indicated by the error bars, while for HAWC the uncertainty band represents the systematic and statistical uncertainty.
Current usage metrics show cumulative count of Article Views (full-text article views including HTML views, PDF and ePub downloads, according to the available data) and Abstracts Views on Vision4Press platform.
Data correspond to usage on the plateform after 2015. The current usage metrics is available 48-96 hours after online publication and is updated daily on week days.
Initial download of the metrics may take a while.