Fig. 12
Download original image
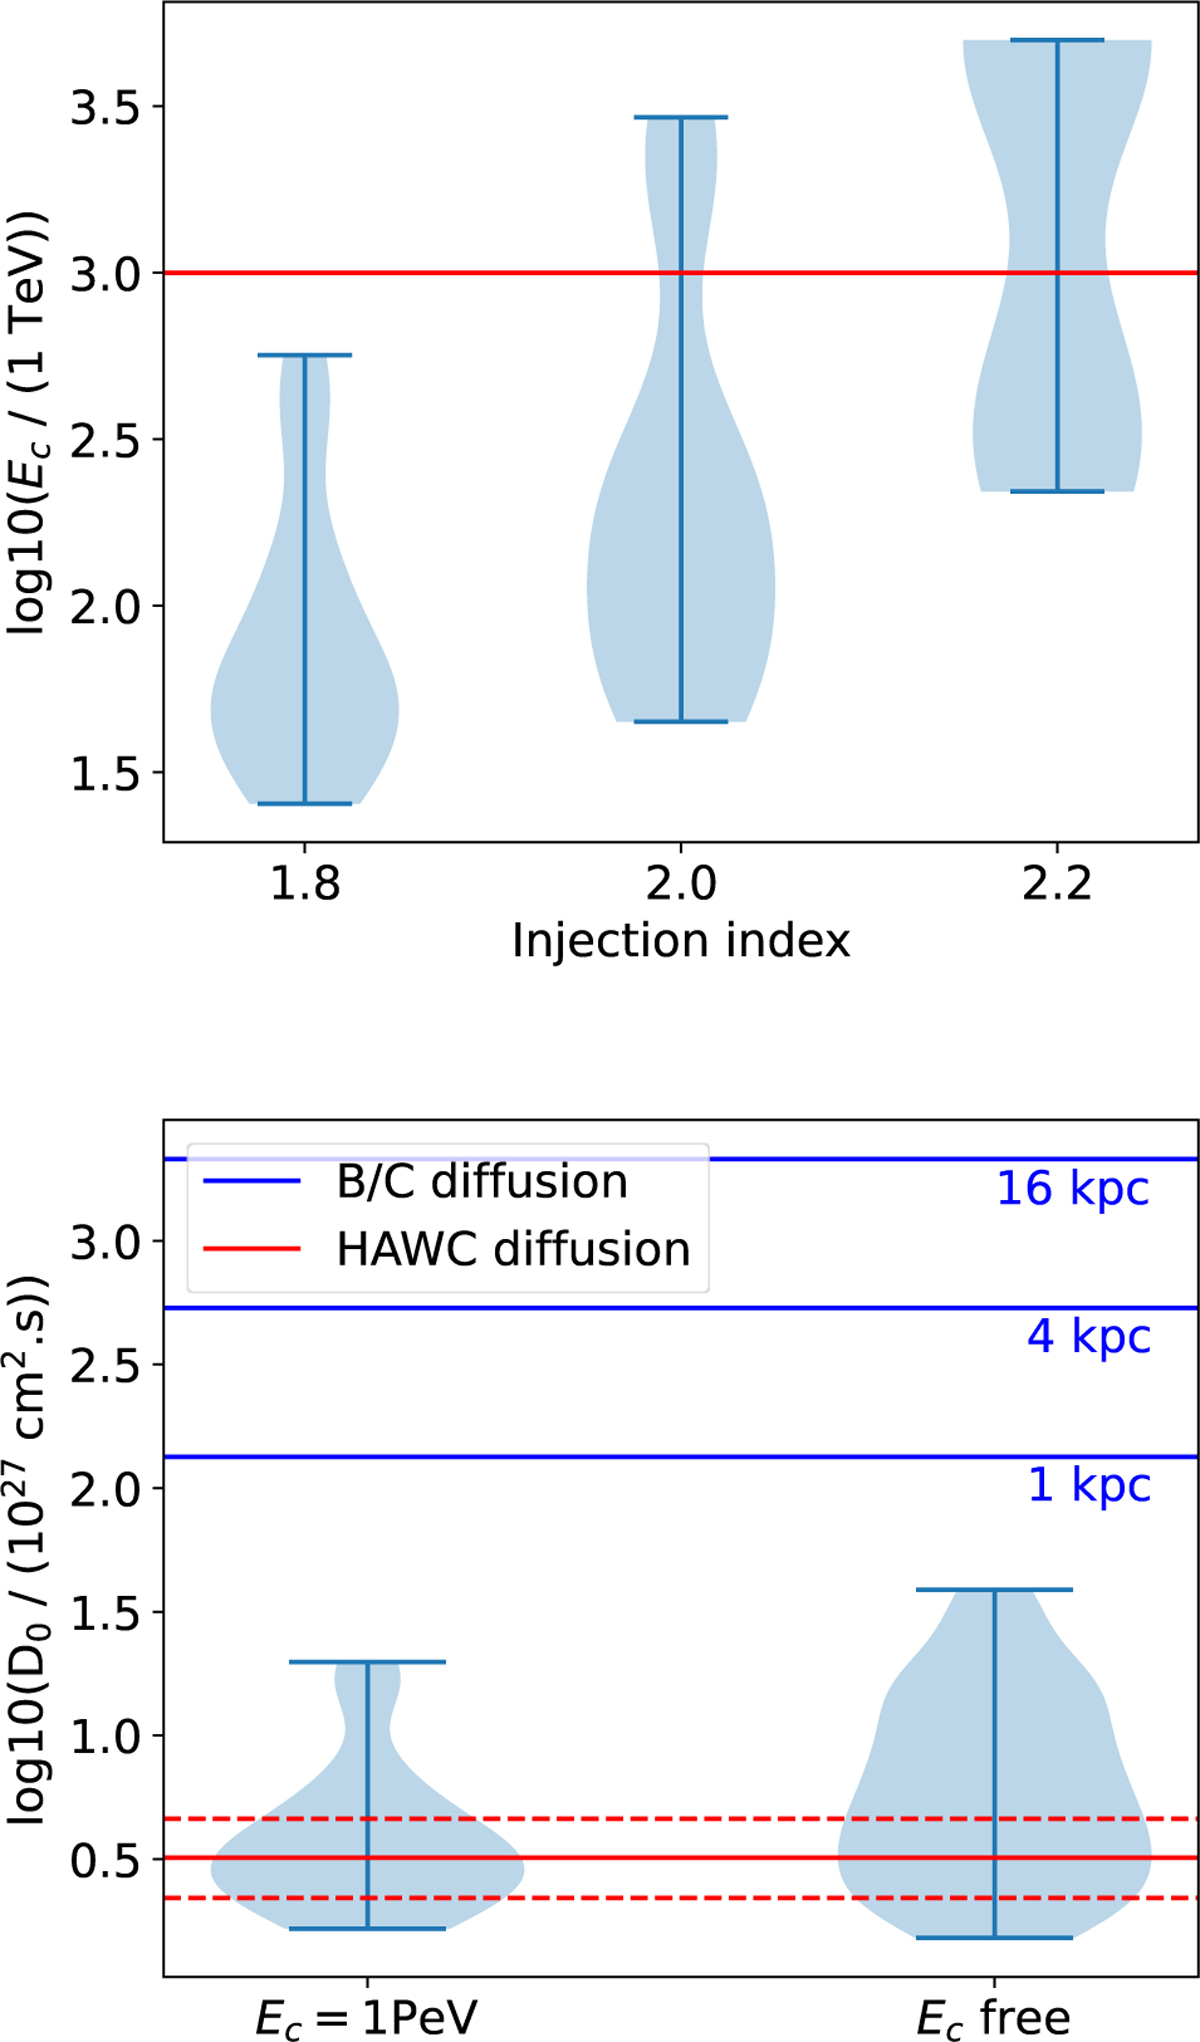
Distribution of models with p-value >0.003, presented as a violin plot, illustrating the kernel probability density. The width of the shaded area represents the proportion of number of fits located at these positions. The upper and lower bars represent the maximum and minimum values. Top: Fitted energy cut-off distribution as a function of injection index for the combined H.E.S.S. and HAWC dataset. The red horizontal line shows the value of energy cut-off chosen for the fixed Ec fit. Bottom: distribution of the fitted diffusion coefficient in the case of Ec = 1 PeV and Ec left free to vary, for a combined fit to H.E.S.S. and HAWC data. Solid lines indicate the value ranges for the B/C diffusion coefficient and the statistical uncertainty of HAWC diffusion coefficient obtained in Abeysekara et al. (2017a).
Current usage metrics show cumulative count of Article Views (full-text article views including HTML views, PDF and ePub downloads, according to the available data) and Abstracts Views on Vision4Press platform.
Data correspond to usage on the plateform after 2015. The current usage metrics is available 48-96 hours after online publication and is updated daily on week days.
Initial download of the metrics may take a while.