Fig. 11
Download original image
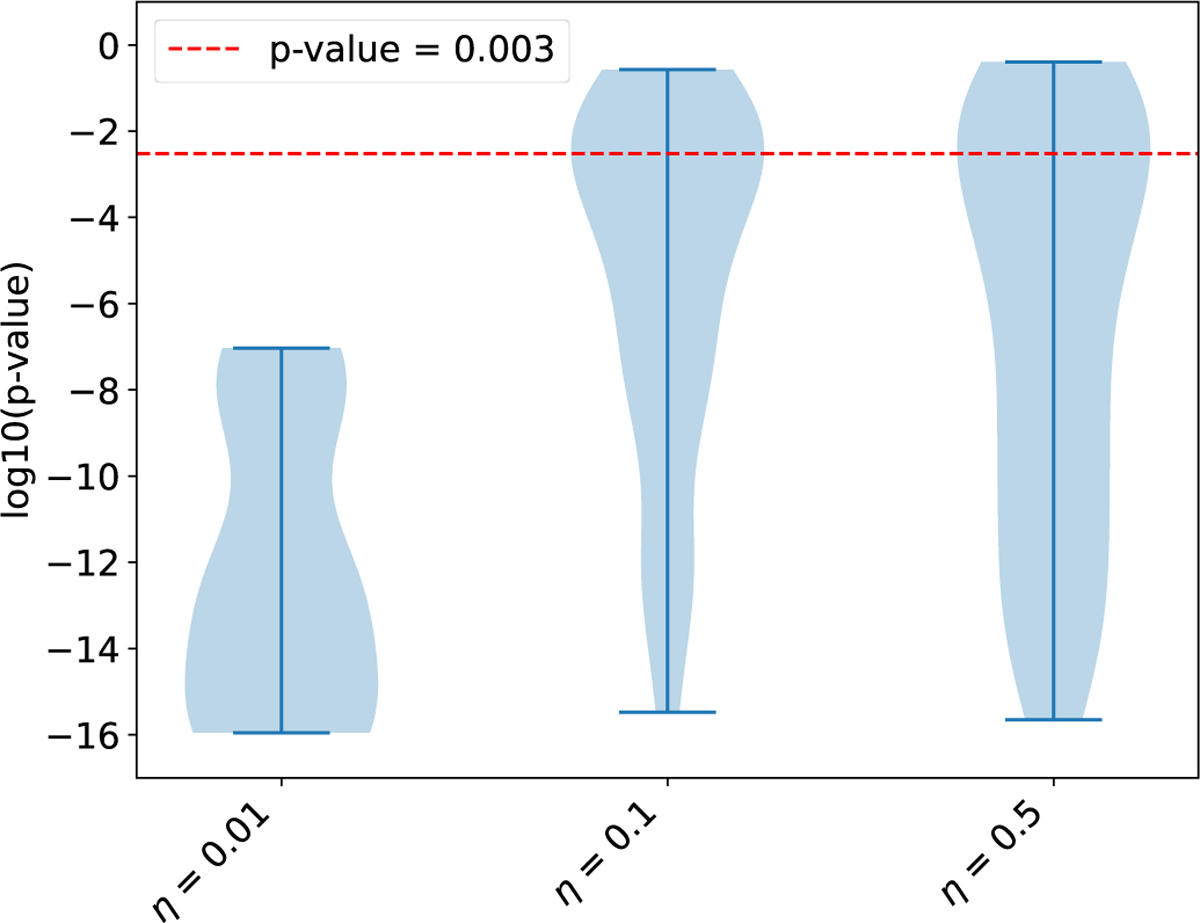
Distribution of p-value for the scanned parameter combinations presented in Table 6, with different values of η parameter, using the H.E.S.S. and HAWC datasets in combination with Ec fixed to 1 PeV. This distribution is presented as violin plot, illustrating kernel probability density. The width of the shaded area represents the proportion of the number of fits located at these position. The upper and lower bar represent the maximum and minimum values. Models with p-value <0.003 are excluded.
Current usage metrics show cumulative count of Article Views (full-text article views including HTML views, PDF and ePub downloads, according to the available data) and Abstracts Views on Vision4Press platform.
Data correspond to usage on the plateform after 2015. The current usage metrics is available 48-96 hours after online publication and is updated daily on week days.
Initial download of the metrics may take a while.