Fig. 8.
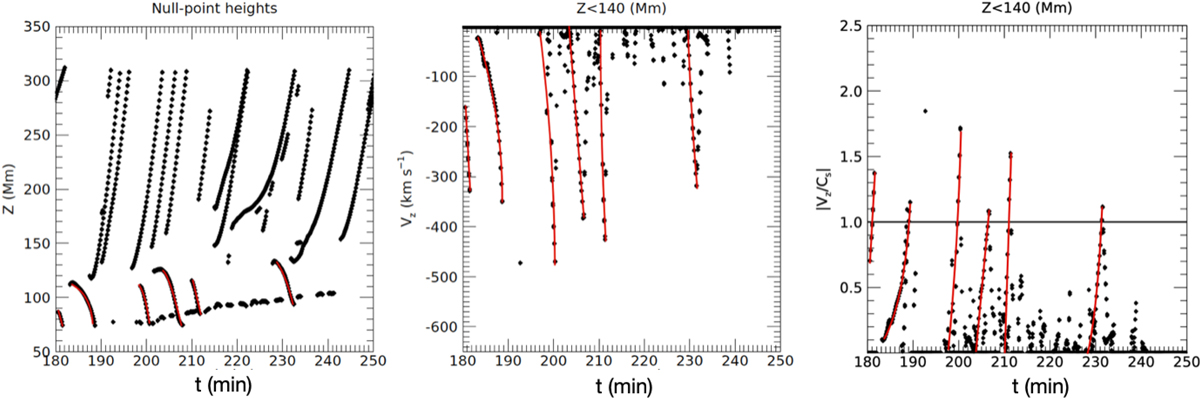
Download original image
Temporal evolution of the detected null-points. Panels from left to right: height vs. time of nulls during the current sheet fragmentation; vz of the plasmoids formed below Z = 140 Mm; downward velocity to the local sound speed ratio for plasmoids formed below Z = 140 Mm. The red lines denote the plasmoids which merge with post-reconnection loops.
Current usage metrics show cumulative count of Article Views (full-text article views including HTML views, PDF and ePub downloads, according to the available data) and Abstracts Views on Vision4Press platform.
Data correspond to usage on the plateform after 2015. The current usage metrics is available 48-96 hours after online publication and is updated daily on week days.
Initial download of the metrics may take a while.