Fig. 7.
Download original image
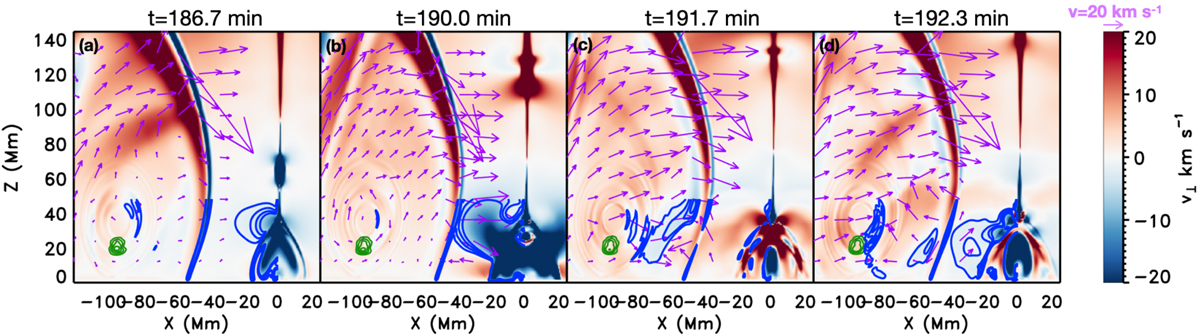
Evolution of v⊥ in a region around the FR1 during the plasmoids formation in the current sheet of the FR2 (saturated). The plasmoid is seen in panel a, at height 50 − 70 Mm, in the elongated current sheet. The purple arrows denote the velocity field. The green lines show the density isocontours. The blue lines denote v⊥ isocontours.
Current usage metrics show cumulative count of Article Views (full-text article views including HTML views, PDF and ePub downloads, according to the available data) and Abstracts Views on Vision4Press platform.
Data correspond to usage on the plateform after 2015. The current usage metrics is available 48-96 hours after online publication and is updated daily on week days.
Initial download of the metrics may take a while.