Fig. 6.
Download original image
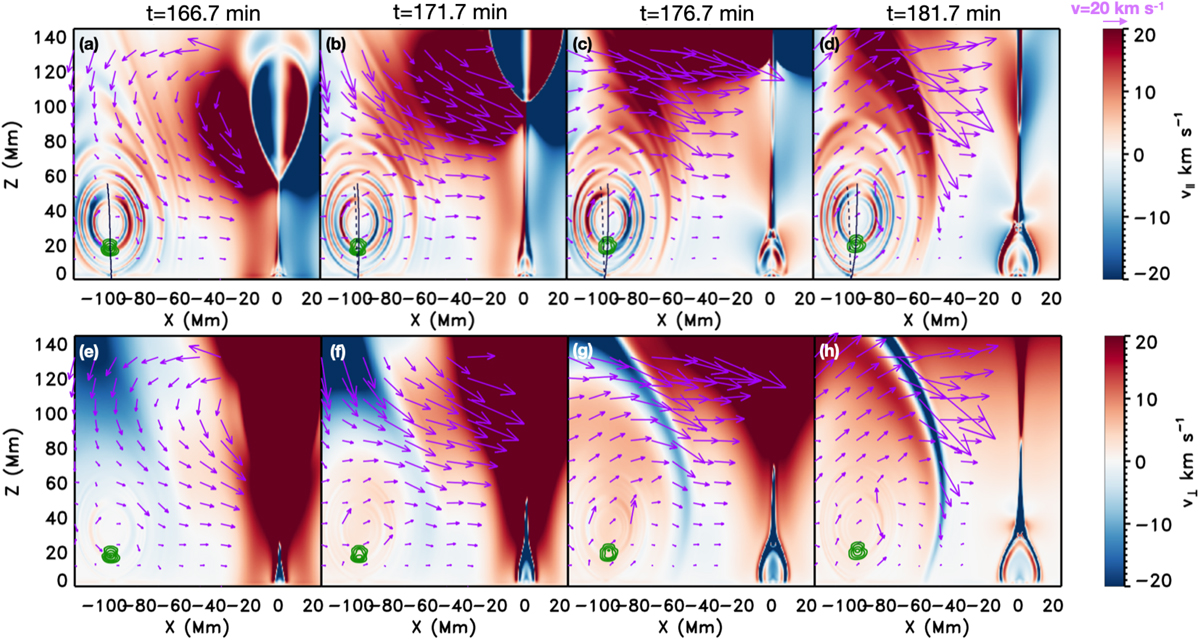
Evolution of v∥ (top panel) and v⊥ (bottom panel) in a region around the FR1 during the FR2 eruption (saturated). The purple arrows denote the velocity field. The green lines show the density isocontours. The dashed and solid black lines denote the vertical axis of the flux rope defined by the criterion Bz = 0 at a time of 166.7 min and time shown in the corresponding panels, respectively.
Current usage metrics show cumulative count of Article Views (full-text article views including HTML views, PDF and ePub downloads, according to the available data) and Abstracts Views on Vision4Press platform.
Data correspond to usage on the plateform after 2015. The current usage metrics is available 48-96 hours after online publication and is updated daily on week days.
Initial download of the metrics may take a while.