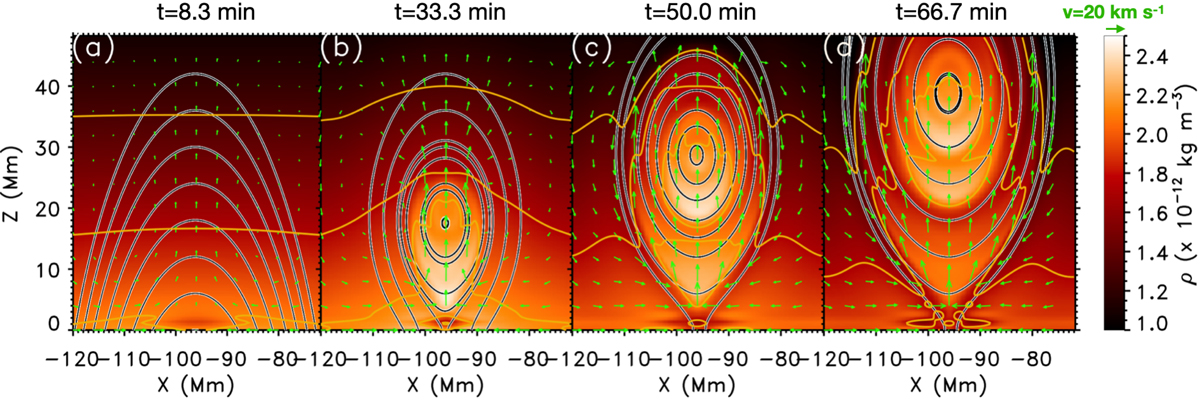
Fig. 2.
Download original image
Evolution of the density and the magnetic field lines during FR1 formation. The yellow lines denote the density isocontours. The green arrows show the velocity field. We note that field lines in the different panels are not the same field lines carrying the same plasma. They are drawn to reflect the topological structure of the magnetic field at a given time.
Current usage metrics show cumulative count of Article Views (full-text article views including HTML views, PDF and ePub downloads, according to the available data) and Abstracts Views on Vision4Press platform.
Data correspond to usage on the plateform after 2015. The current usage metrics is available 48-96 hours after online publication and is updated daily on week days.
Initial download of the metrics may take a while.