Fig. 13.
Download original image
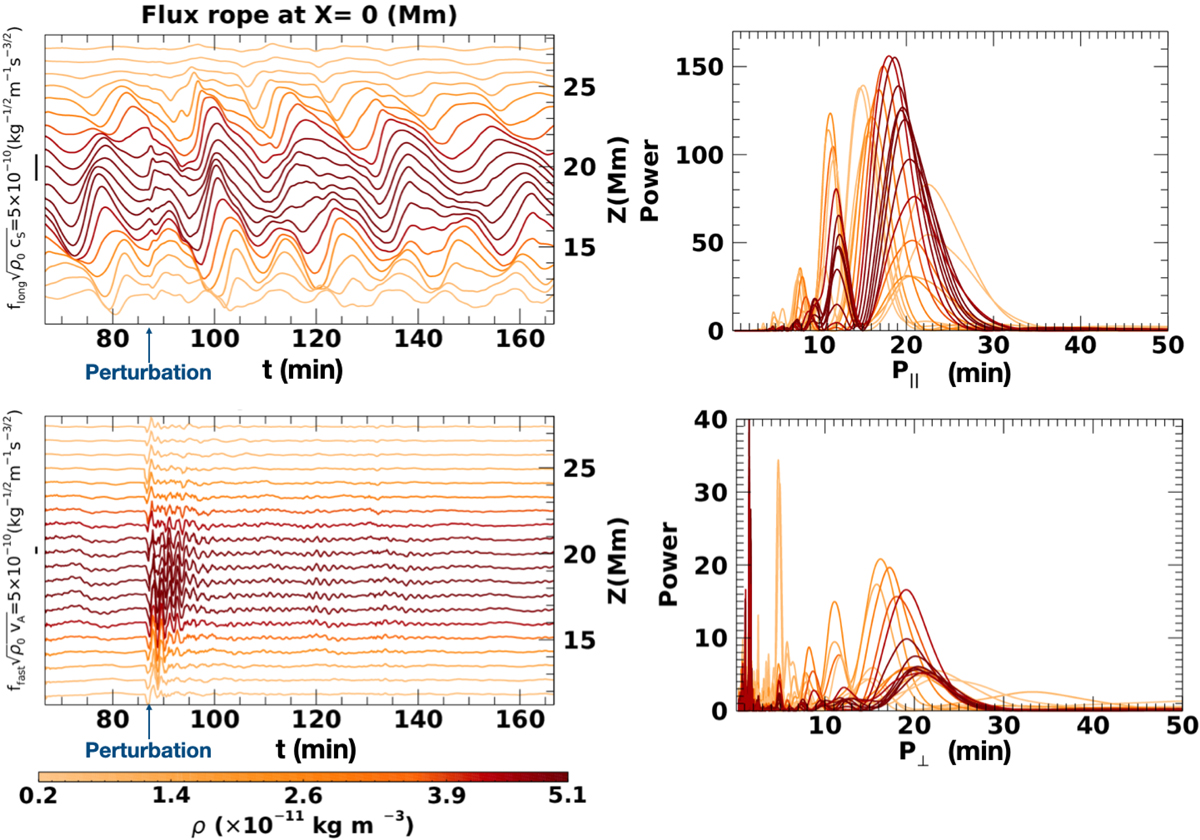
Temporal evolution of the wave field. Left panels: ![]() (top);
(top); ![]() (bottom) at the center of mass at the selected field lines of the flux rope at x = 0 Mm. Right panels: the periodograms of the
(bottom) at the center of mass at the selected field lines of the flux rope at x = 0 Mm. Right panels: the periodograms of the ![]() (top) and
(top) and ![]() (bottom) in time-interval 83 − 167 min. The color bar denotes the maximum initial density at each field line. The left vertical axis indicates the velocity amplitude scale. The right vertical axis denotes the vertical location of the dips of the selected magnetic field lines.
(bottom) in time-interval 83 − 167 min. The color bar denotes the maximum initial density at each field line. The left vertical axis indicates the velocity amplitude scale. The right vertical axis denotes the vertical location of the dips of the selected magnetic field lines.
Current usage metrics show cumulative count of Article Views (full-text article views including HTML views, PDF and ePub downloads, according to the available data) and Abstracts Views on Vision4Press platform.
Data correspond to usage on the plateform after 2015. The current usage metrics is available 48-96 hours after online publication and is updated daily on week days.
Initial download of the metrics may take a while.