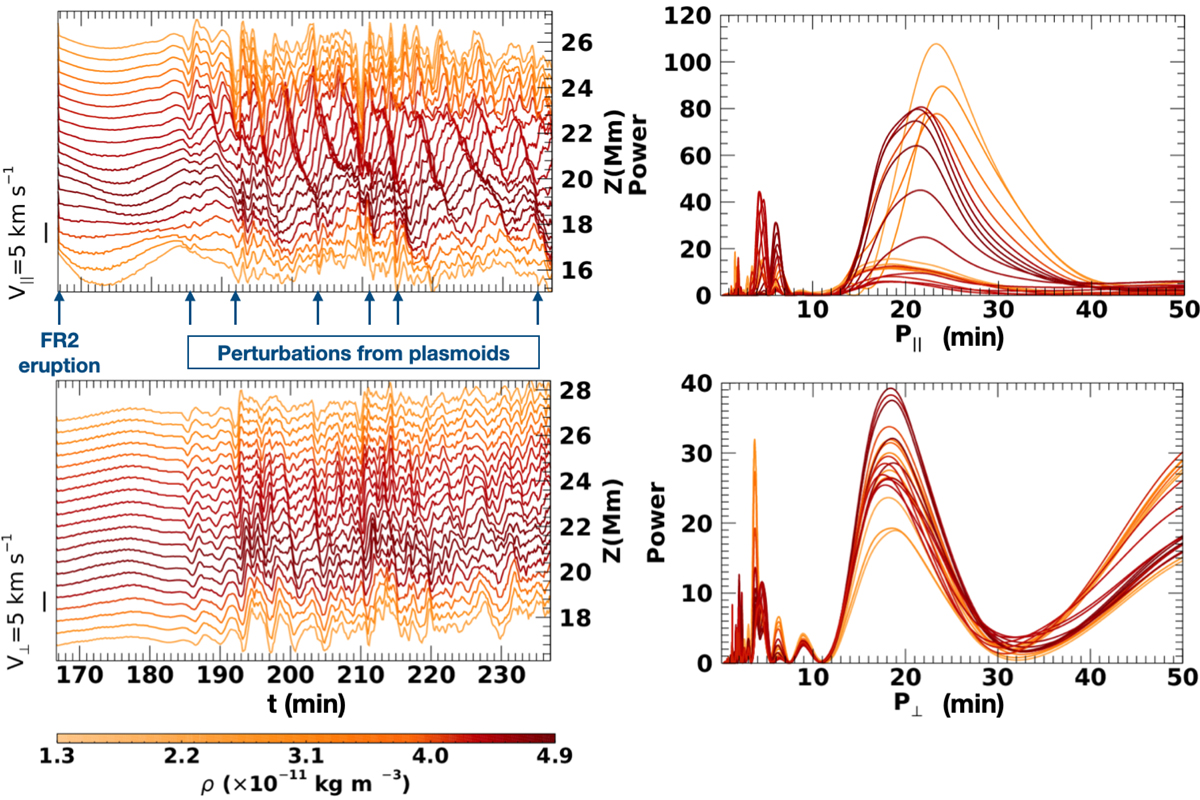
Fig. 10.
Download original image
Temporal evolution of the velocity field in the prominence region. Left panels: v∥ (top) and v⊥ (bottom) of the fluid elements shown with red-blue diamonds in Fig. 4d after the eruption of FR2. The blue arrows denote the time arrival of the perturbation from the confluence of the plasmoids denoted with the red lines in Fig. 8. Right panels: periodograms of the v∥ (top) and v⊥ (bottom) in time-interval 166.7 − 233 min. The color bar denotes the density of the fluid elements. The left vertical axis indicates the velocity amplitude scale. The right vertical axis denotes the initial vertical positions of the fluid elements.
Current usage metrics show cumulative count of Article Views (full-text article views including HTML views, PDF and ePub downloads, according to the available data) and Abstracts Views on Vision4Press platform.
Data correspond to usage on the plateform after 2015. The current usage metrics is available 48-96 hours after online publication and is updated daily on week days.
Initial download of the metrics may take a while.