Fig. 2.
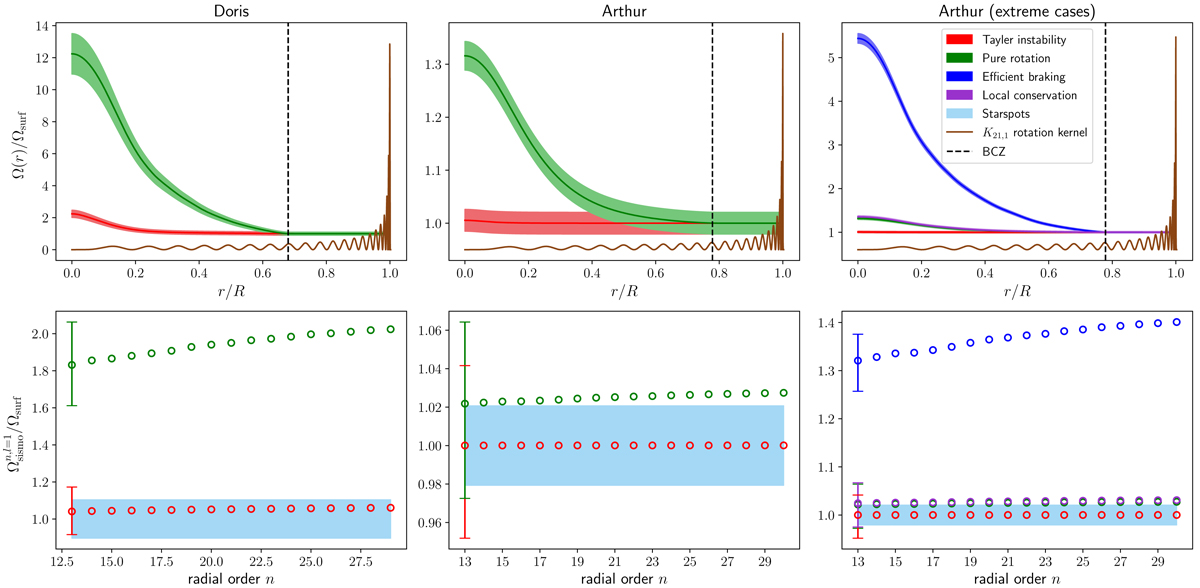
Download original image
Rotational profiles and splittings of Doris and Arthur considering different AM transport prescriptions. Top line: rotation profiles of Doris (left panel) and Arthur (centre and right panels). The base of the convective zone (BCZ) is shown as a dashed black line. The rotation kernel around the νmax, namely K21, 1, is shown in brown, and is rescaled and shifted vertically for illustration purposes. Bottom line: ratio of the rotation rate predicted by asteroseismology and starsport measurements for Doris (left panel) and Arthur (centre and right panels). The open circles are the theoretical predications, considering different AM transport prescriptions, accounting only for hydrodynamic processes (green circles), or for hydrodynamic processes and magnetic Tayler instability (red circles). The shallow convective envelope of Arthur likely implies an inefficient braking. For Arthur, we also tested extreme cases (right panels) with an AM transport with efficient braking (blue circles) or assuming local AM conservation (purple circles). The error bar corresponds to the precision of the average observational rotational splitting measured by OB18, and the blue area shows a solid-body rotation profile with the observational uncertainty of the surface rate from starspot measurements.
Current usage metrics show cumulative count of Article Views (full-text article views including HTML views, PDF and ePub downloads, according to the available data) and Abstracts Views on Vision4Press platform.
Data correspond to usage on the plateform after 2015. The current usage metrics is available 48-96 hours after online publication and is updated daily on week days.
Initial download of the metrics may take a while.