Fig. 13
Download original image
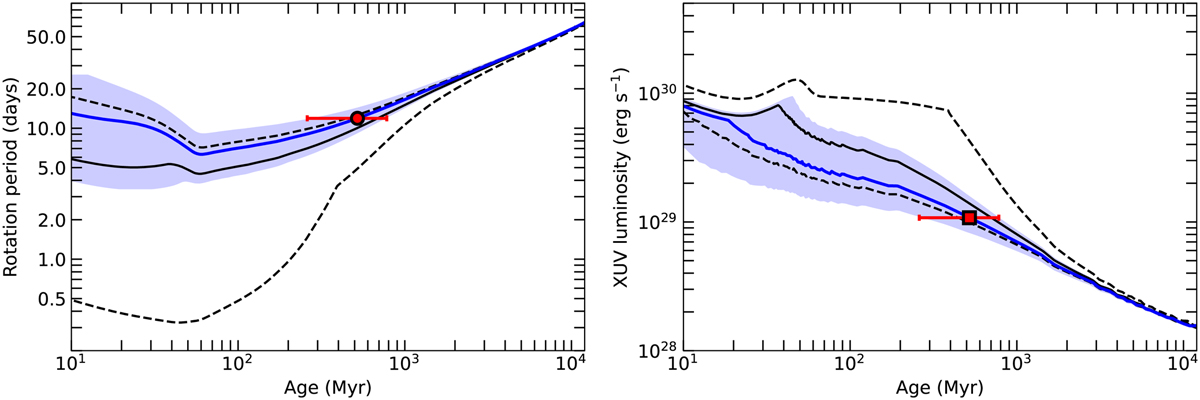
History of HD 207496. Left panel: plot showing the modelled rotational history from the Johnstone et al. (2021) model for a 0.8 M⊙ star (black line), with the 2σ spread based on the distribution of initial rotation periods (dashed black lines). The measured period and age of HD 207496 is plotted as a red circle, and its modelled rotational history as a blue line, with the uncertainty in the history shown as a shaded blue region, as described in Sect. 5.2. Right panel: plot showing the corresponding XUV luminosity tracks for the models on the left-hand side panel. The expected XUV luminosity for HD 207496 b, based on the rotation-activity relation, is shown as a red square.
Current usage metrics show cumulative count of Article Views (full-text article views including HTML views, PDF and ePub downloads, according to the available data) and Abstracts Views on Vision4Press platform.
Data correspond to usage on the plateform after 2015. The current usage metrics is available 48-96 hours after online publication and is updated daily on week days.
Initial download of the metrics may take a while.