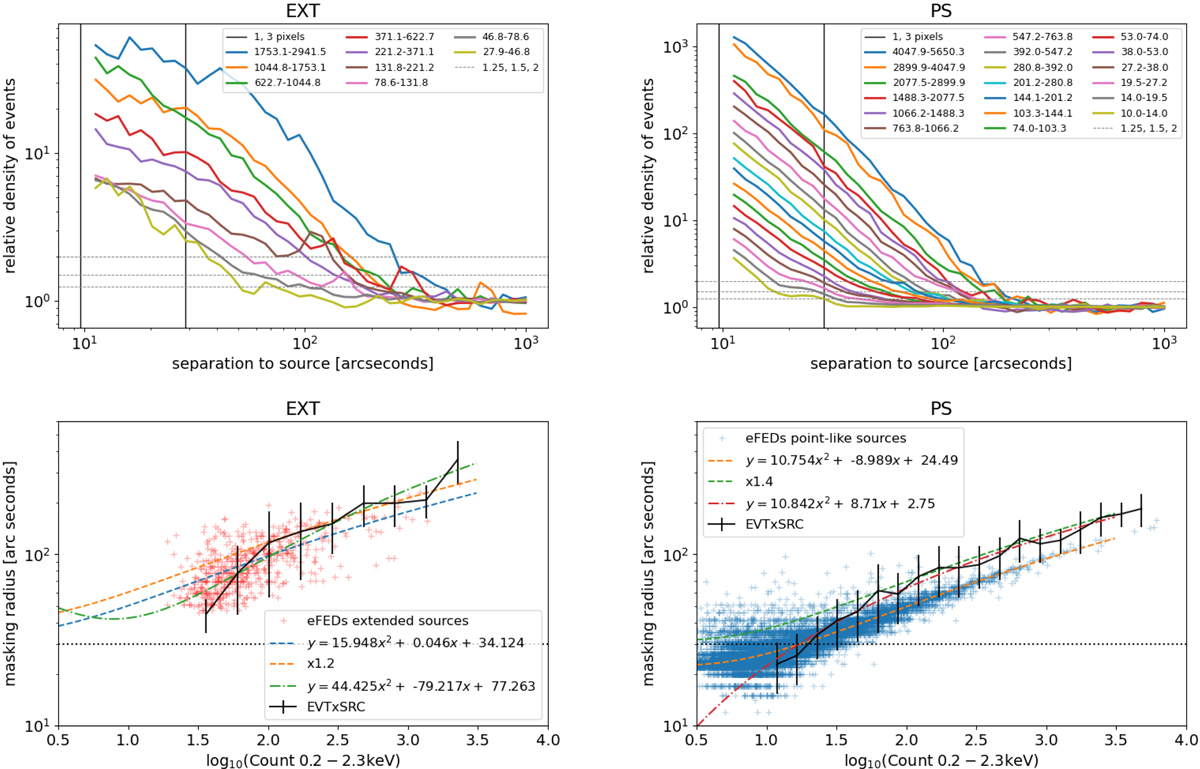
Fig. A.1.
Download original image
Cross-correlation between sources and events as a function of angular separation for extended (EXT, top-left panel) and point-like (PS, top-right panel) X-ray sources. The lower panels show the masking radius vs. log10 of the counts measured. The average masking radius obtained with the cross-correlation is shown with the black line. The masking radius obtained with eSASS/srctool for individual sources is systematically lower than the black line. Its best-fit polynomial (dashed blue line) is multiplied by 1.2 (extended sources) or 1.4 (point sources) to align with the black line.
Current usage metrics show cumulative count of Article Views (full-text article views including HTML views, PDF and ePub downloads, according to the available data) and Abstracts Views on Vision4Press platform.
Data correspond to usage on the plateform after 2015. The current usage metrics is available 48-96 hours after online publication and is updated daily on week days.
Initial download of the metrics may take a while.