Open Access
Fig. B.3.
Download original image
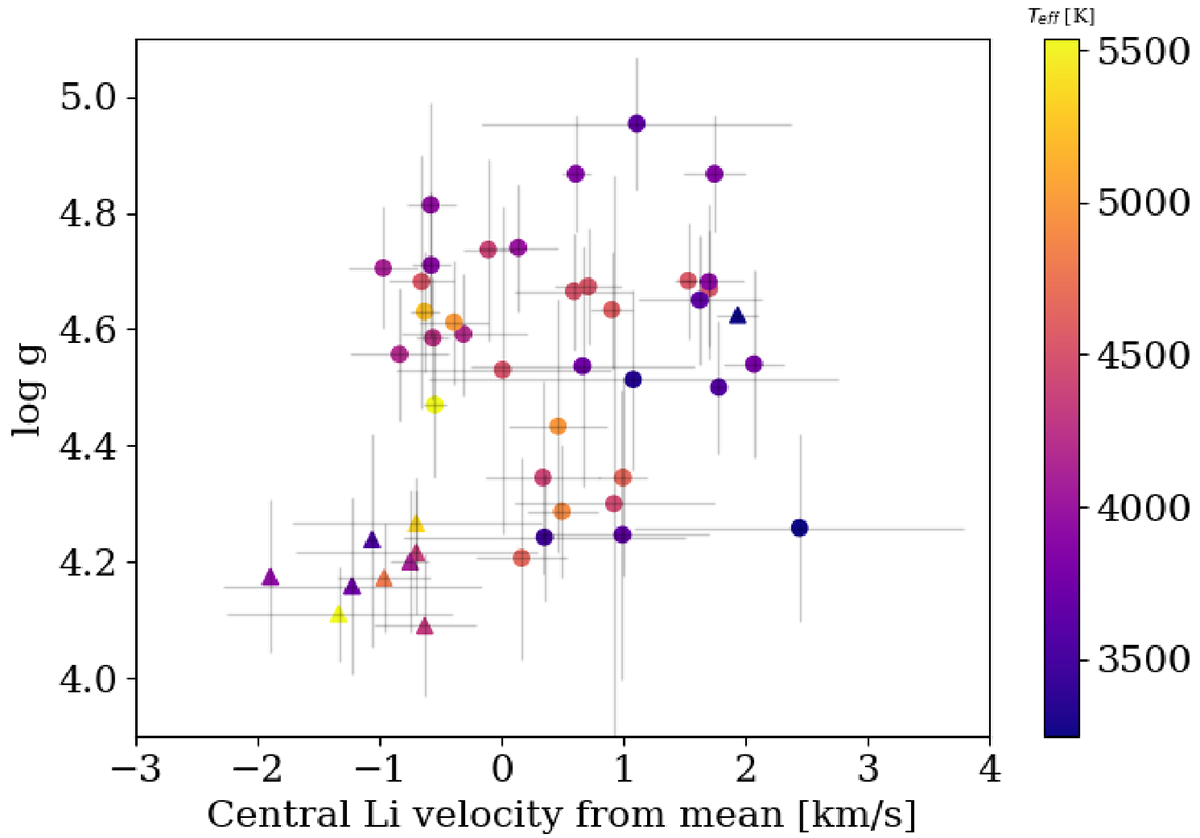
Comparison of log g and mean central velocity of the Li feature for each target. Circles are ROTFIT measurements of the PENELLOPE spectra, and triangles are from TIC. Points are coloured by the respective Teff measurement. The Pearson correlation coefficients are r = 0.35 and p = 0.02.
Current usage metrics show cumulative count of Article Views (full-text article views including HTML views, PDF and ePub downloads, according to the available data) and Abstracts Views on Vision4Press platform.
Data correspond to usage on the plateform after 2015. The current usage metrics is available 48-96 hours after online publication and is updated daily on week days.
Initial download of the metrics may take a while.