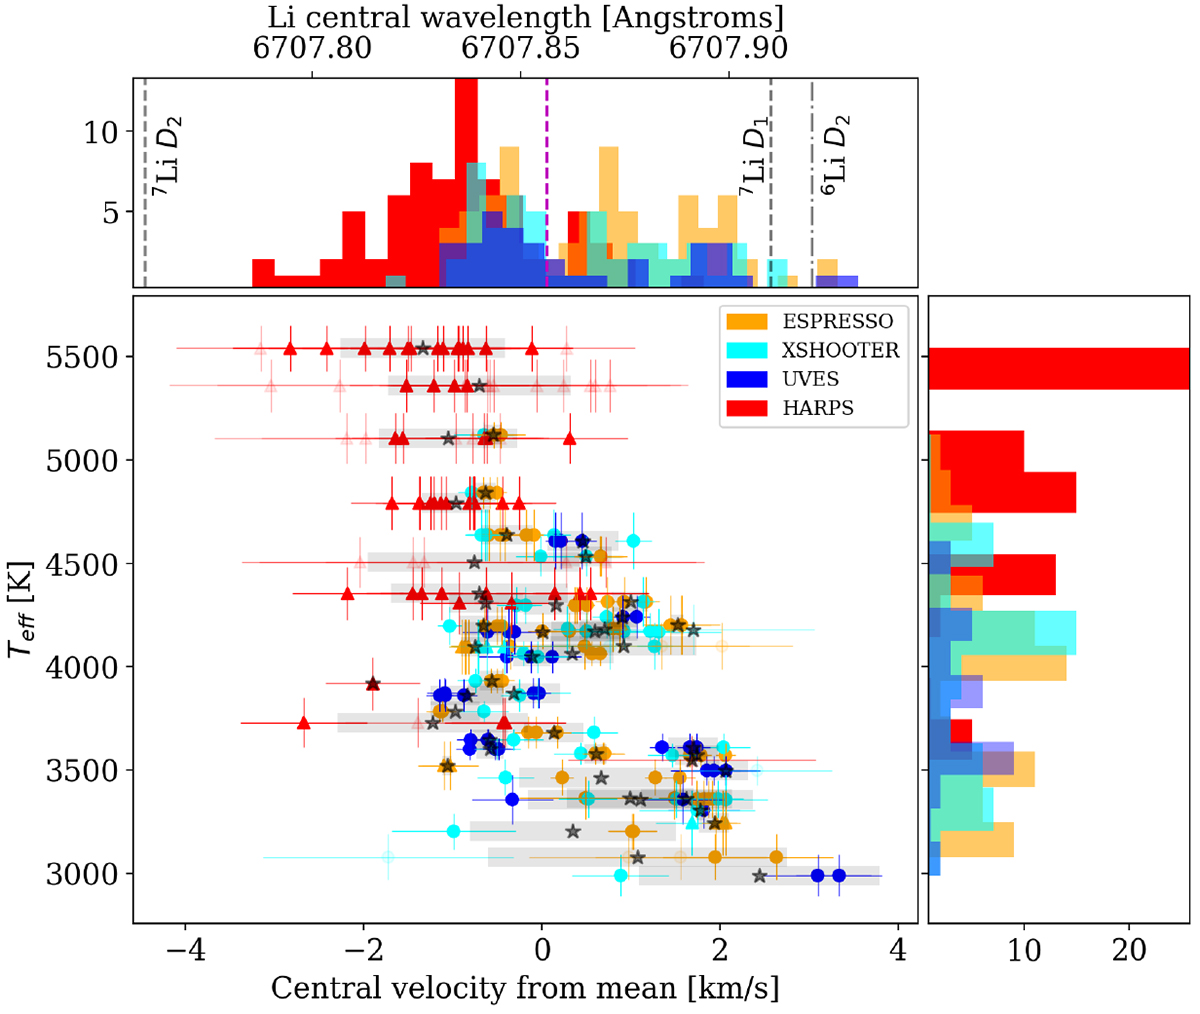
Fig. 2.
Download original image
Teff vs. velocity difference from the mean measured Li centroid position. Stars indicate the mean measured position for each target. The shaded boxes show the 1σ spread of measurements. Circles indicate that Teff measurements are from ROFIT/PENELLOPE spectra, and triangles are taken from the TESS input catalogue. We note an anti-correlation (r = −0.58) between Teff and mean position: lower Teff stars show more redshifted central values. The total velocity error bars arise from adding the standard errors of the RV and Gaussian centre measurements in quadrature. Faded markers and error bars are measurements with total velocity errors 0.75 km s−1. The mean measured Li centroid and positions of the D line components are indicated in the top histogram.
Current usage metrics show cumulative count of Article Views (full-text article views including HTML views, PDF and ePub downloads, according to the available data) and Abstracts Views on Vision4Press platform.
Data correspond to usage on the plateform after 2015. The current usage metrics is available 48-96 hours after online publication and is updated daily on week days.
Initial download of the metrics may take a while.