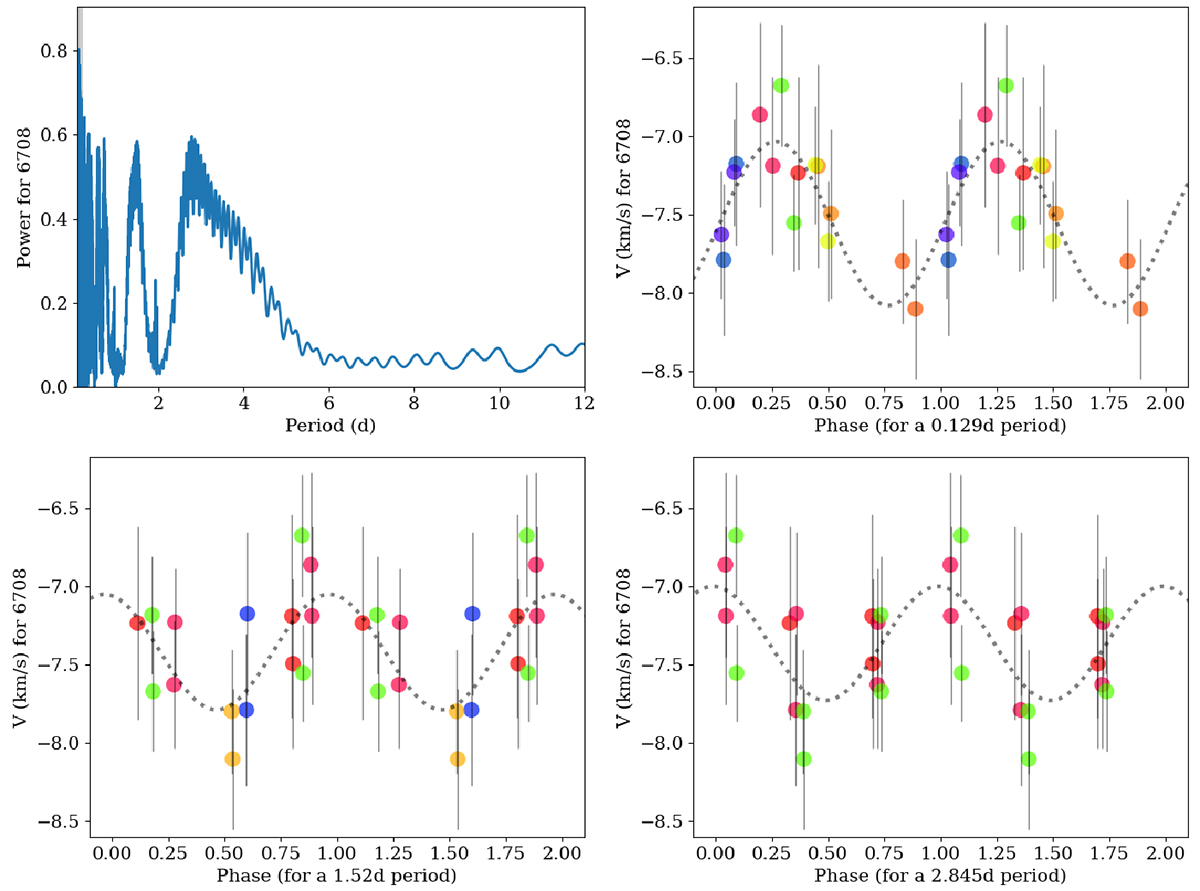
Fig. C.2.
Download original image
LY Lup LSP and phase-folded Li positions (procedure as described in Campbell-White et al. (2021). The velocities are those measured from the reference wavelength of 6708 Å and are already corrected for stellar RV. The phase plots therefore represent the relative shift in Li position. Points are coloured by observations corresponding to different phases. The photometric period of 2.84d from Kiraga (2012) is one of the peaks from the periodogram. False-alarm probabilities are lower for the shorter periods (∼ 20%), but the significance is still low due to the number of data points.
Current usage metrics show cumulative count of Article Views (full-text article views including HTML views, PDF and ePub downloads, according to the available data) and Abstracts Views on Vision4Press platform.
Data correspond to usage on the plateform after 2015. The current usage metrics is available 48-96 hours after online publication and is updated daily on week days.
Initial download of the metrics may take a while.