Fig. 1.
Download original image
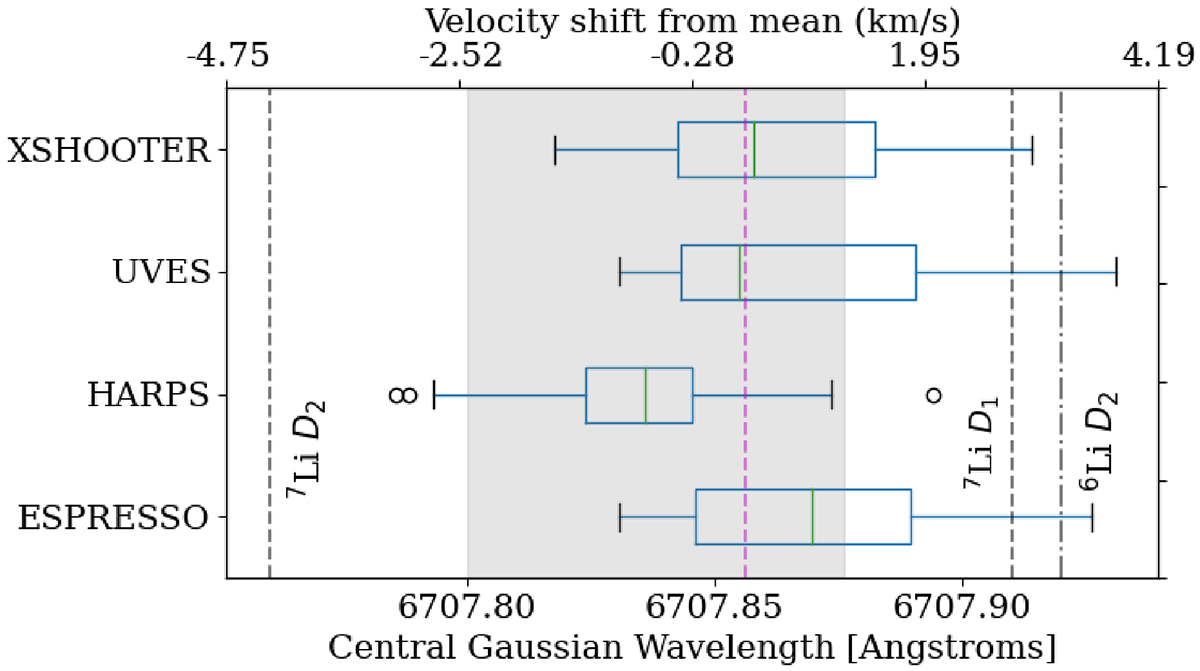
Box plot of the resulting central wavelength position from fitting all of the PENELLOPE VLT (ESPRESSO, UVES, X-shooter) and the further HARPS YSO spectra. The boxes extend from the lower to upper quartile values of the data, with a green line at the median. The whiskers extend to 1.5 times the box range. Outliers are indicated by circles. The mean central wavelength position is marked by the dashed magenta line. Positions of the 7Li D1, D2, and 6Li D2 lines are indicated by the dashed and dash-dotted black lines. The grey shaded area indicates the range of values of the Li I line centres that were used as reference for the RV calculations in previous works.
Current usage metrics show cumulative count of Article Views (full-text article views including HTML views, PDF and ePub downloads, according to the available data) and Abstracts Views on Vision4Press platform.
Data correspond to usage on the plateform after 2015. The current usage metrics is available 48-96 hours after online publication and is updated daily on week days.
Initial download of the metrics may take a while.