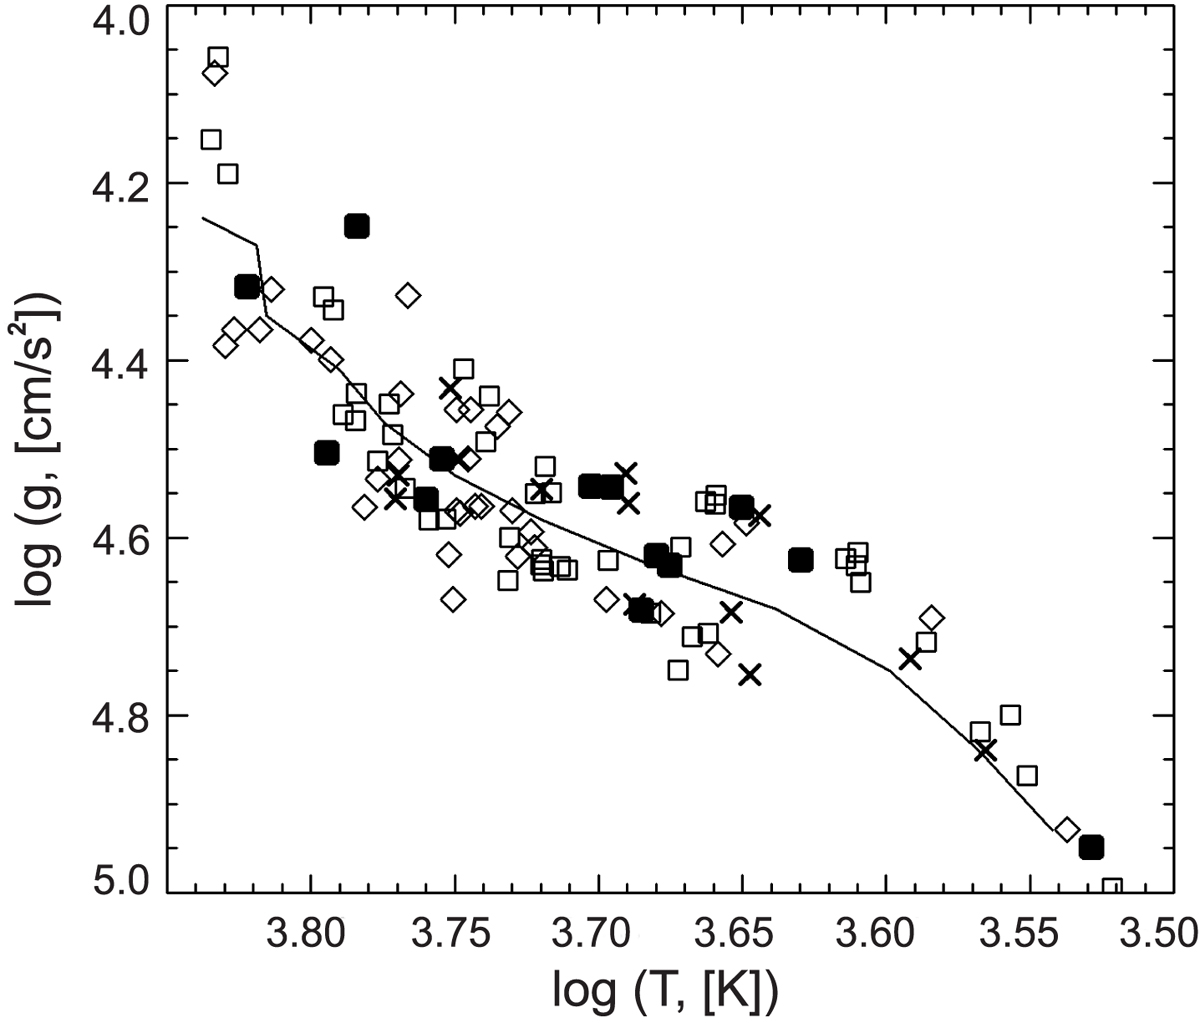
Fig. 3.
Download original image
Analog of the HR diagram for the stellar sub-sets from Table A.1 (open squares for positive, and rhombi for negatives drift rates, respectively), Table A.2 (crosses), and Table A.3 (solid squares). The solid line depicts the main sequence, obtained using stellar models of fast rotators (Amard et al. 2019) with maximal surface gravity log(g).
Current usage metrics show cumulative count of Article Views (full-text article views including HTML views, PDF and ePub downloads, according to the available data) and Abstracts Views on Vision4Press platform.
Data correspond to usage on the plateform after 2015. The current usage metrics is available 48-96 hours after online publication and is updated daily on week days.
Initial download of the metrics may take a while.