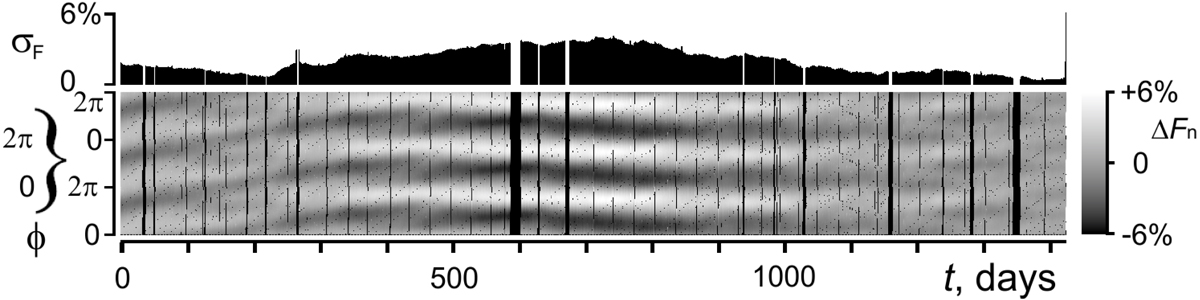
Fig. 1.
Download original image
Dynamic diagram of stellar activity pattern (DDSAP) for the star KIC 9009514 with an effective temperature of T = 4569 (according to MAST) and Prot = 1.211 days (according to Nielsen et al. 2013), which shows a typical activity cycle. The accompanying upper plot presents the varying activity index σF, as a sequence of the standard deviations of ΔFn, calculated for each given one-rotation interval. The vertical black bands and strips as well as the black dots in the DDSAP are caused by gaps in photometric data.
Current usage metrics show cumulative count of Article Views (full-text article views including HTML views, PDF and ePub downloads, according to the available data) and Abstracts Views on Vision4Press platform.
Data correspond to usage on the plateform after 2015. The current usage metrics is available 48-96 hours after online publication and is updated daily on week days.
Initial download of the metrics may take a while.