Fig. 8
Download original image
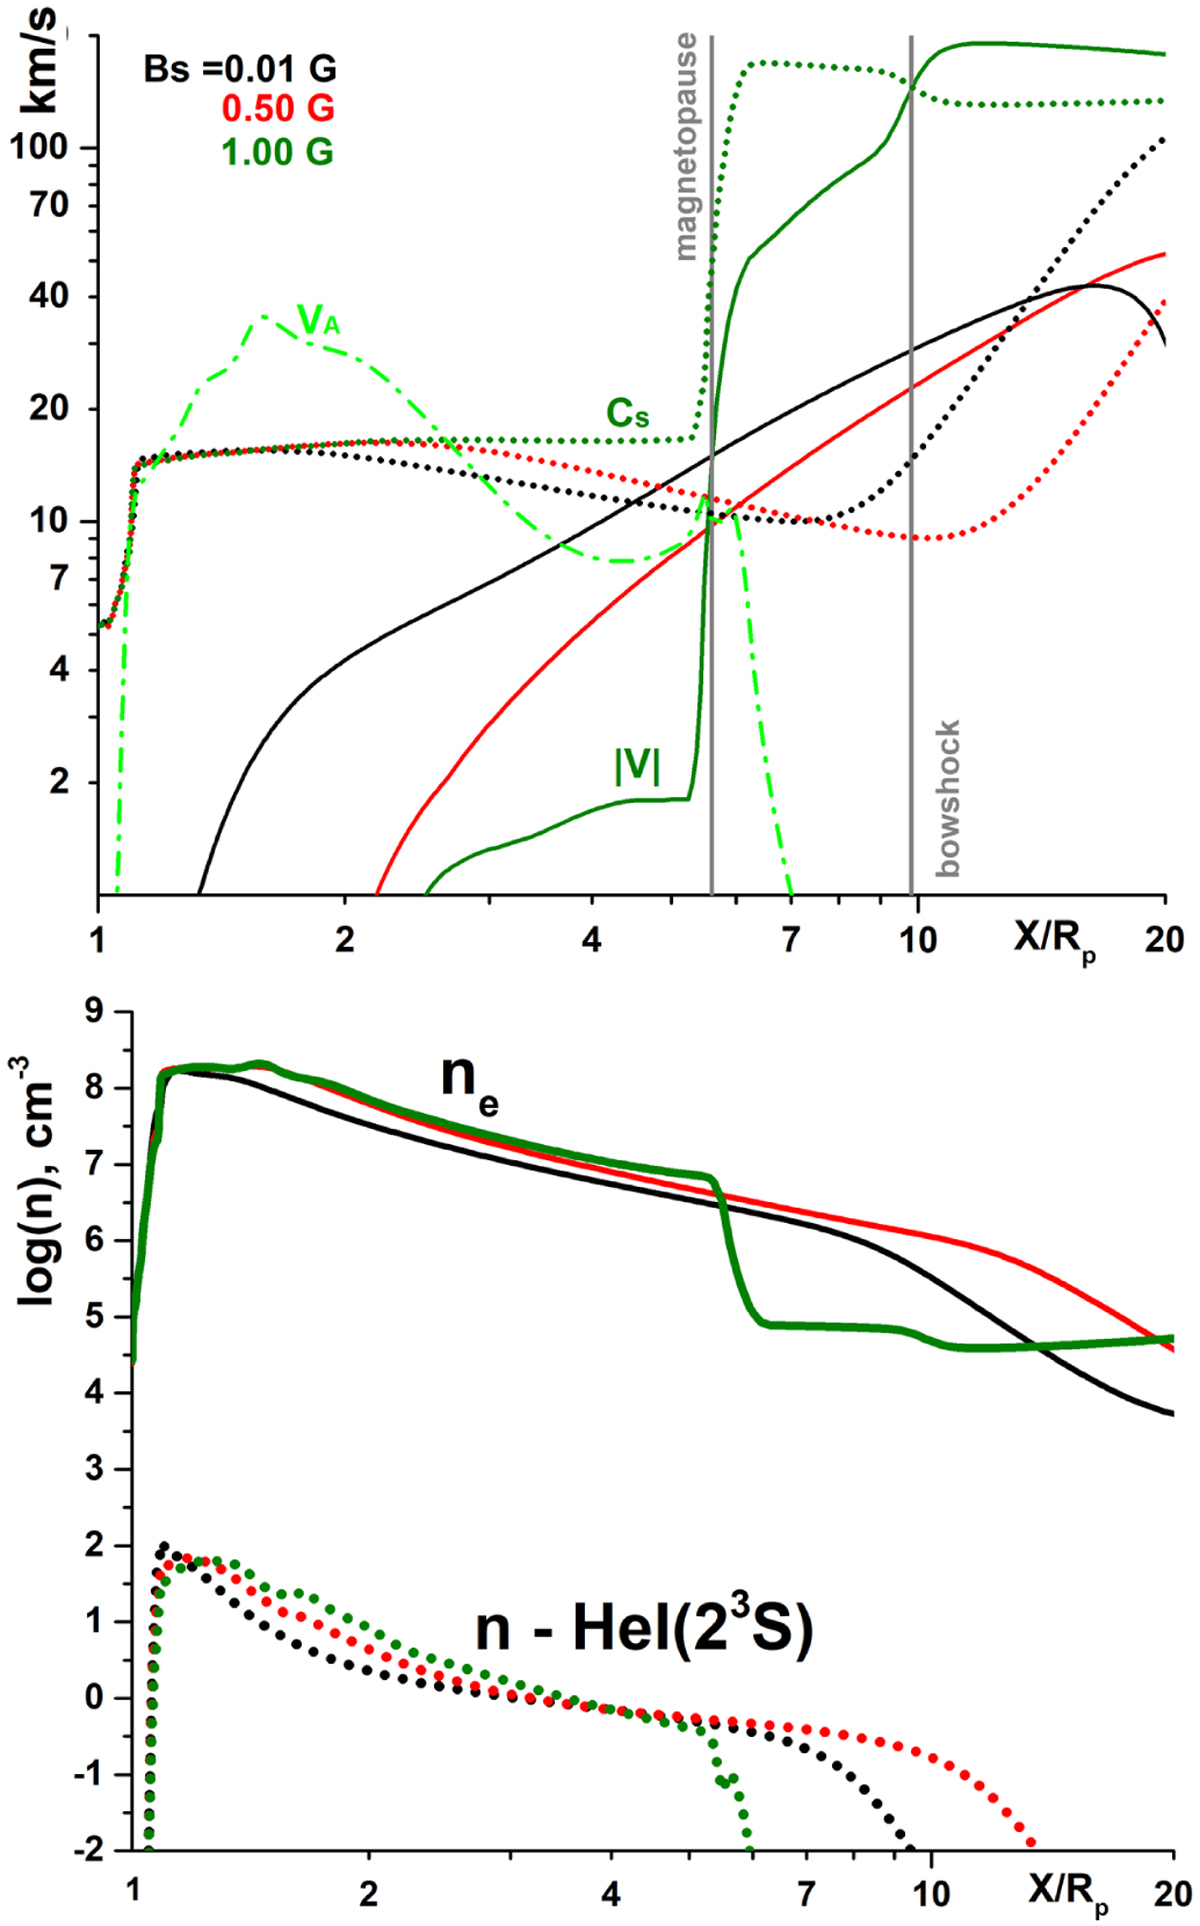
Profiles of the main physical quantities along the star-planet connecting line. Top: Proton bulk (solid line) and thermal (dotted line) velocity in the X direction along the star–planet connecting line. The black and red lines are for the runs computed considering a planetary magnetic field of 0.01 and 0.5 G, respectively (runs N1 and N2). The dark green lines are for the run computed considering the strongest planetary magnetic field and stellar wind (run N4). The bright green dash-dotted line shows the Alfvén velocity in the X direction for the case of the strongest planetary magnetic field and stellar wind (run N4). Bottom: Electron (solid line) and He I (23S) density (dotted line) profiles in the X direction. As in the top panel, the black and red lines are for the runs computed considering a planetary magnetic field of 0.01 and 0.5 G, respectively (runs N1 and N2), while the dark green lines are for the run computed considering the strongest planetary magnetic field and stellar wind (run N4).
Current usage metrics show cumulative count of Article Views (full-text article views including HTML views, PDF and ePub downloads, according to the available data) and Abstracts Views on Vision4Press platform.
Data correspond to usage on the plateform after 2015. The current usage metrics is available 48-96 hours after online publication and is updated daily on week days.
Initial download of the metrics may take a while.