Fig. 11
Download original image
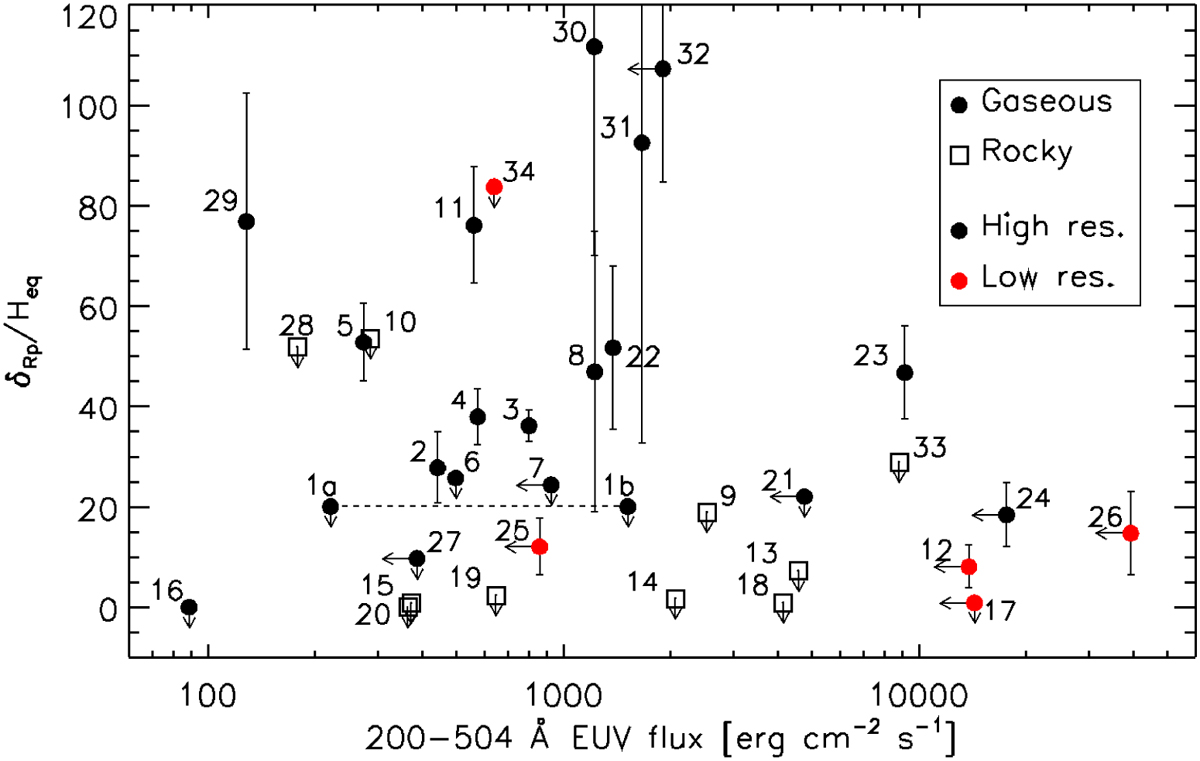
Size of the measured He I absorption signal normalised to the atmospheric scale height computed considering the planetary parameters listed in Table A.1 and a mean molecular weight of a pure hydrogen atmosphere, as a function of the incident stellar EUV flux (in logarithmic scale) in the 200–504 Å wavelength range. Arrows indicate upper limits. The numbers close to each point are the labels listed in the first column of Table A.1. Gas giants are marked by filled circles, while rocky planets are marked by empty squares (we apply the term ‘rocky’ to planets that presumably do not host an extensive primary hydrogen-dominated atmosphere). Black and red symbols indicate planets for which the search for metastable He I absorption has been conducted employing high- and low-resolution techniques, respectively (low-resolution techniques comprise both low-resolution spectroscopy, R < 10 000, and narrow-band photometry). The dashed horizontal line connects the two possible locations of WASP-80b, which differ solely on the assumption of a high or low [Fe/O] coronal abundance. V 1298 Tau d (#35) is not shown, because the estimated He I absorption signal lies significantly out of scale compared to the rest of the sample and has an uncertainty of larger than 100% (see Table A.1).
Current usage metrics show cumulative count of Article Views (full-text article views including HTML views, PDF and ePub downloads, according to the available data) and Abstracts Views on Vision4Press platform.
Data correspond to usage on the plateform after 2015. The current usage metrics is available 48-96 hours after online publication and is updated daily on week days.
Initial download of the metrics may take a while.