Fig. 9
Download original image
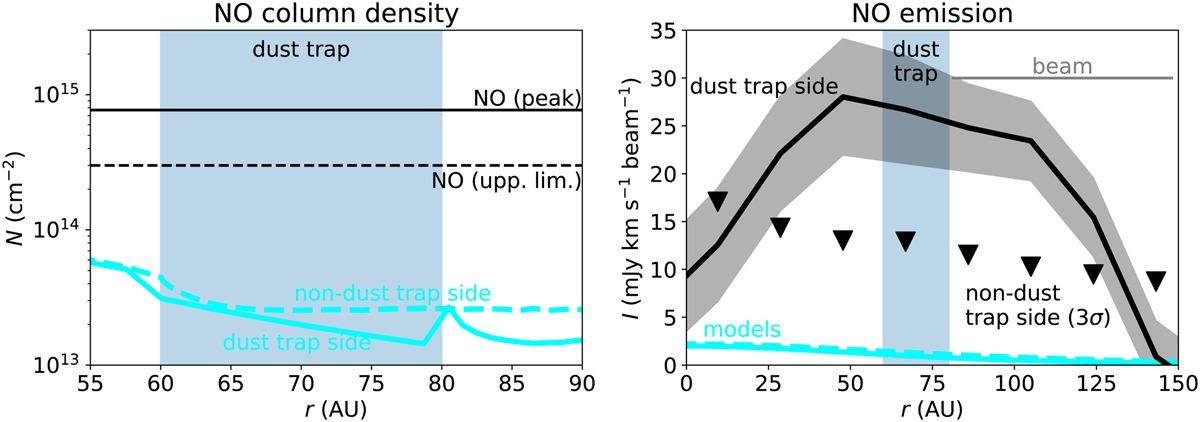
NO column density (left) and emission (right) predicted by the model for the dust trap side (solid blue) and non-dust trap side (dashed blue). The horizontal black lines in the left panel indicate the NO column density or the upper limit derived by the observations. The black line in the right panel indicates the horizontal cut of the NO emission through the dust trap and the triangles indicate the 3σ upper limit on the intensity in the north. The horizontal grey line in the right panel indicates the beam size. Note: the two panels have a different horizontal axis.
Current usage metrics show cumulative count of Article Views (full-text article views including HTML views, PDF and ePub downloads, according to the available data) and Abstracts Views on Vision4Press platform.
Data correspond to usage on the plateform after 2015. The current usage metrics is available 48-96 hours after online publication and is updated daily on week days.
Initial download of the metrics may take a while.