Fig. 8
Download original image
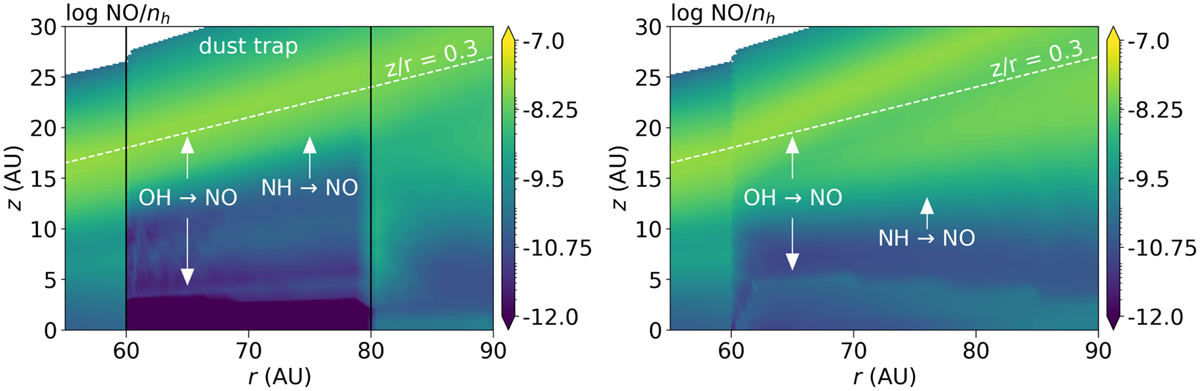
NO abundance in the model with a dust trap (left) and without a dust trap (right). Note: the NO abundance inside the dust trap is lower than in the model without a dust trap except for a thin layer at z/r ~0.3 (white dashed line), opposite of what is observed in the observations. This shows that the fiducial model is not sufficient to reproduce the observations.
Current usage metrics show cumulative count of Article Views (full-text article views including HTML views, PDF and ePub downloads, according to the available data) and Abstracts Views on Vision4Press platform.
Data correspond to usage on the plateform after 2015. The current usage metrics is available 48-96 hours after online publication and is updated daily on week days.
Initial download of the metrics may take a while.