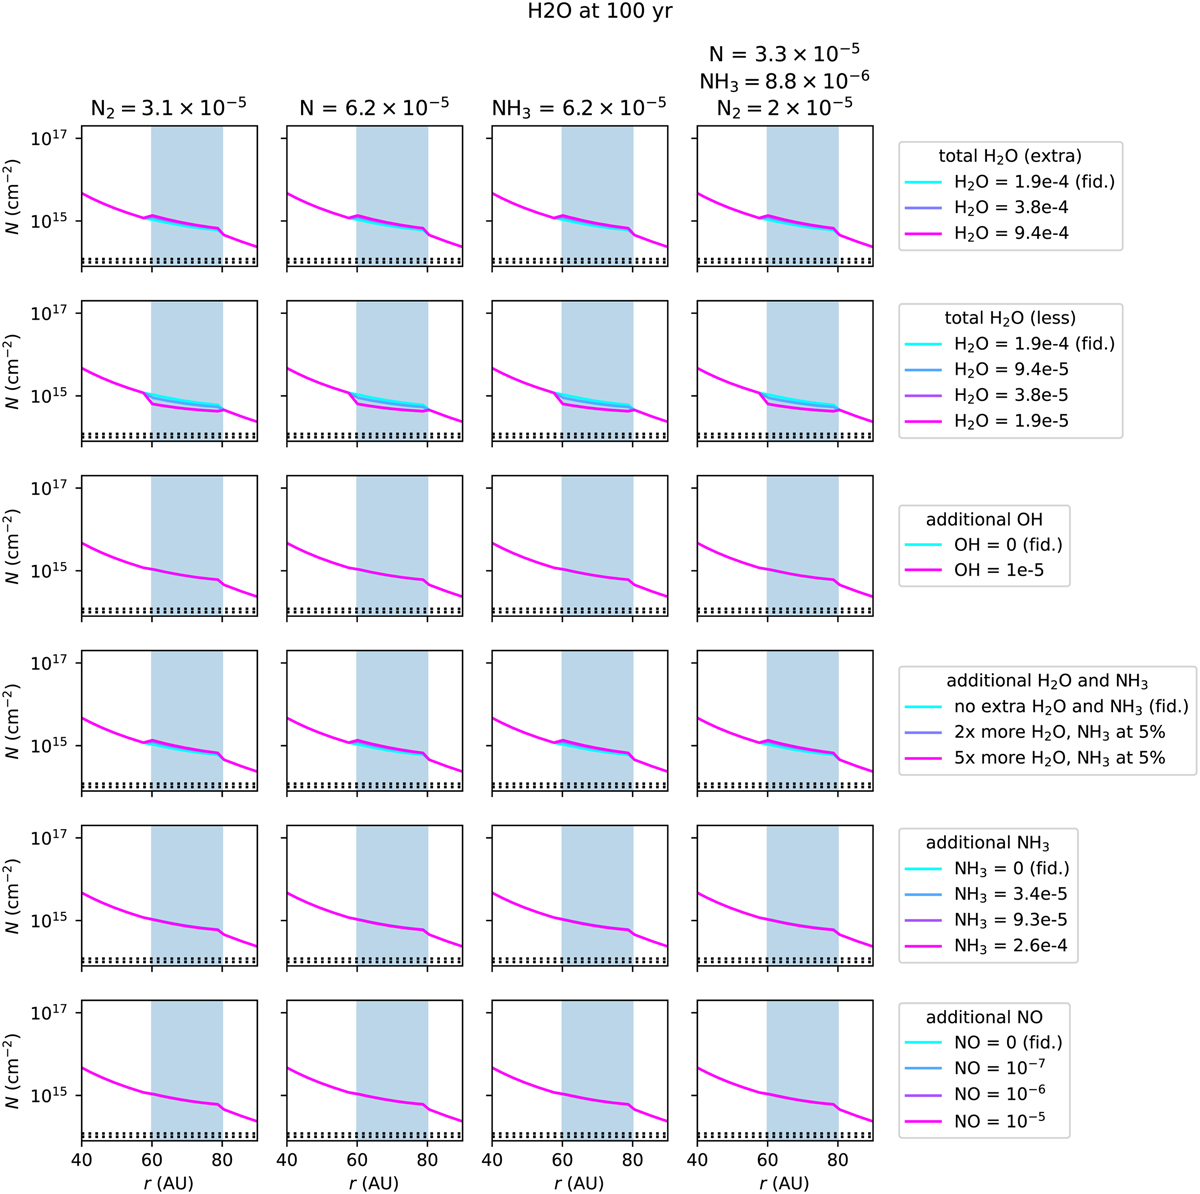
Fig. B.7
Download original image
Predicted H2O column density in the region where Tgas ≥ 150 K, for different initial distributions of nitrogen (columns) and sublimating ices (rows). Tgas ≥ 150 K is the temperature range probed by the Herschel PACS observations. Horizontal black dotted lines indicate the upper limit on the H2O column density derived from the observations at 150 and 200 K. All models overpredict the upper limit on the H2O column density. This could be due to optically thick dust at 51 − 220 μm hiding part of the H2O column in the IRS 48 disk.
Current usage metrics show cumulative count of Article Views (full-text article views including HTML views, PDF and ePub downloads, according to the available data) and Abstracts Views on Vision4Press platform.
Data correspond to usage on the plateform after 2015. The current usage metrics is available 48-96 hours after online publication and is updated daily on week days.
Initial download of the metrics may take a while.