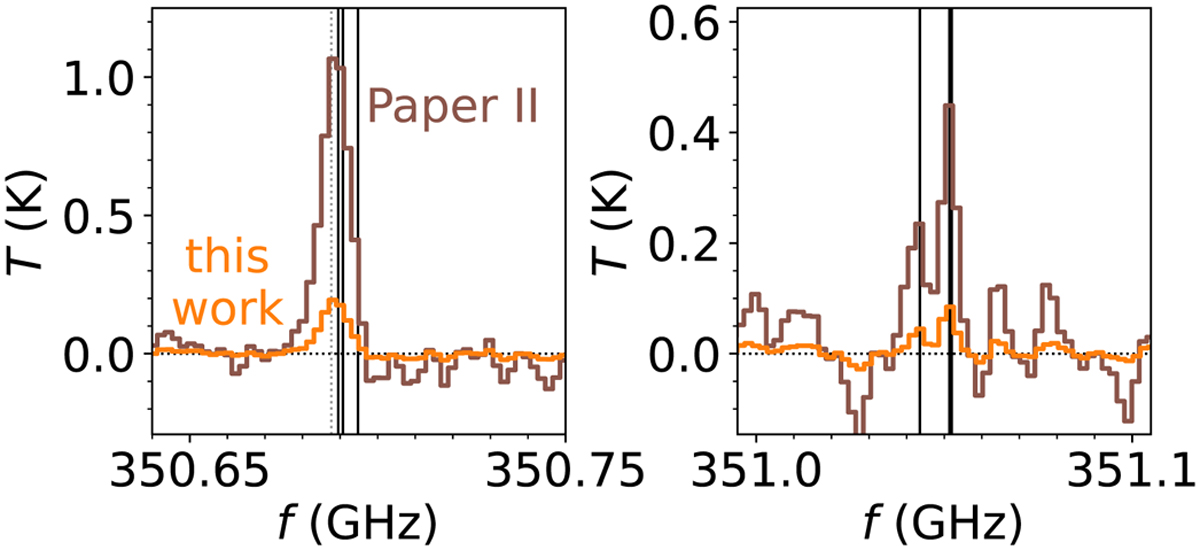
Fig. A.2
Download original image
Observed and stacked spectrum of the NO lines detected inside 115 AU in units of K. The brown line indicates the spectrum presented in Paper II and the orange line presents the corrected spectrum with a 5 times lower flux presented in this work. The detected NO lines are indicated with the vertical black lines. The thick line at 351.052 GHz indicates that there are two NO lines at the same frequency. The methanol line is indicated with the dotted grey line. For details see Sect. 3.2. Note: there is a difference in the vertical scale between the panels.
Current usage metrics show cumulative count of Article Views (full-text article views including HTML views, PDF and ePub downloads, according to the available data) and Abstracts Views on Vision4Press platform.
Data correspond to usage on the plateform after 2015. The current usage metrics is available 48-96 hours after online publication and is updated daily on week days.
Initial download of the metrics may take a while.