Fig. A.1
Download original image
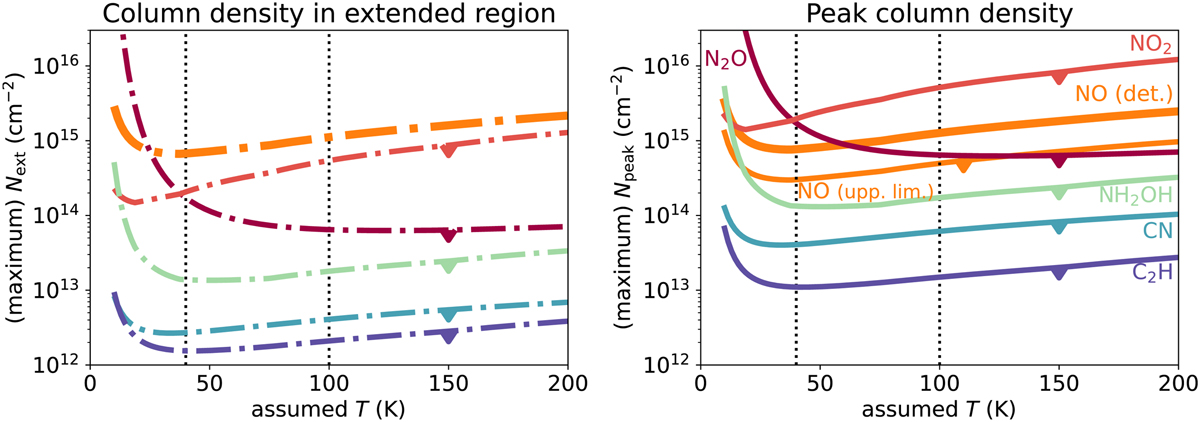
Derived (upper limits on the) column densities in the IRS 48 disk as a function of assumed temperature. The left panel presents column densities computed in an extended region (Next; dash-dotted lines) and the right panel those in a single beam (Npeak; solid lines). The NO column density is indicated with the thick orange line. The upper limit on the N2O, NO2, NH2OH, CN, and C2H are indicated with the dark red, red, green, blue, and purple lines respectively. The upper limit on the NO column density in the north is indicated with the thin orange line in the right panel. The dotted vertical black lines indicate the two assumed temperatures for which the (upper limits on the) column densities are listed in Table 2.
Current usage metrics show cumulative count of Article Views (full-text article views including HTML views, PDF and ePub downloads, according to the available data) and Abstracts Views on Vision4Press platform.
Data correspond to usage on the plateform after 2015. The current usage metrics is available 48-96 hours after online publication and is updated daily on week days.
Initial download of the metrics may take a while.