Open Access
Fig. 12
Download original image
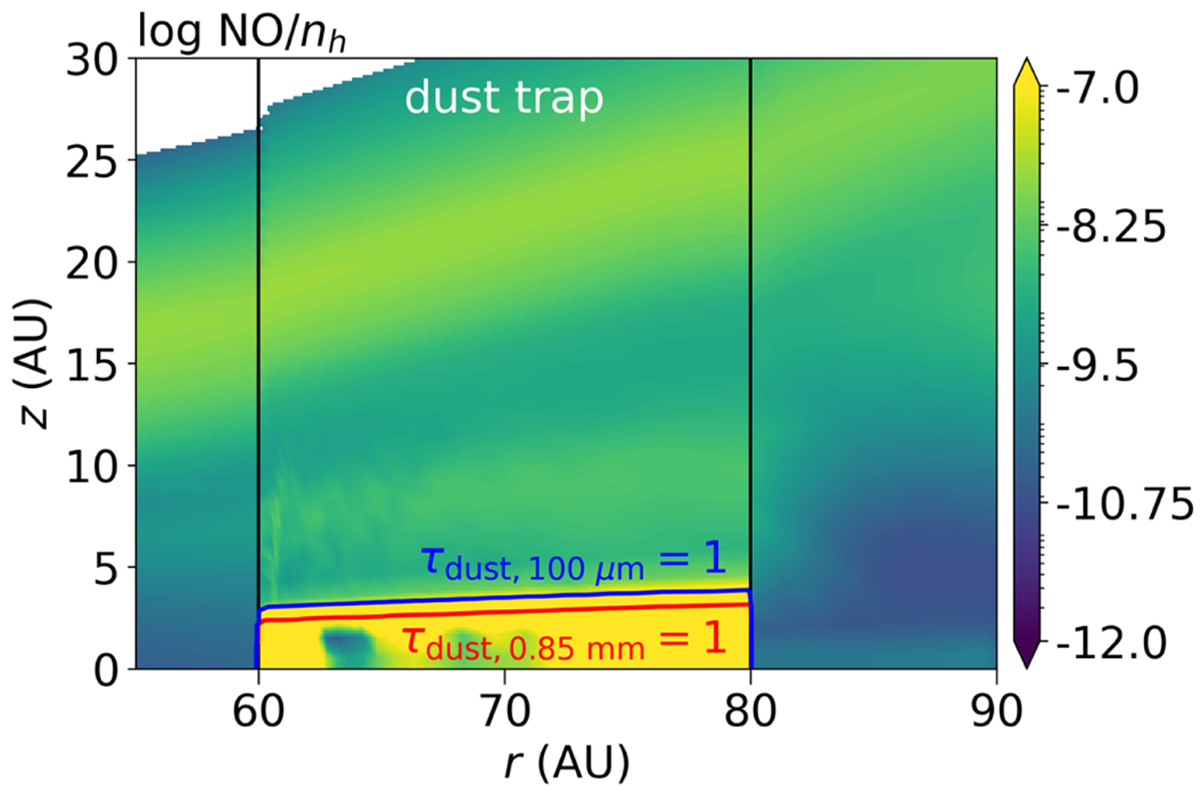
NO abundance after 100 yr in the dust trap model with an initial NO abundance of 10−5. Most of the NO is hidden below the τdust, 0.85 mm = 1 surface at 0.85 mm indicated by the red contour. The blue contour indicates τdust, 100 μm = 1 at 100 μm, representative of the wavelength of the H2O and OH upper limits.
Current usage metrics show cumulative count of Article Views (full-text article views including HTML views, PDF and ePub downloads, according to the available data) and Abstracts Views on Vision4Press platform.
Data correspond to usage on the plateform after 2015. The current usage metrics is available 48-96 hours after online publication and is updated daily on week days.
Initial download of the metrics may take a while.